We all use water. All day. Every day. And in the UK, we are lucky enough that we can take using clean, running water from a tap, for granted. For this reason, most of us probably don’t think too much about how and when we are using water; and unless you have a smart meter it can be very difficult to fully visualise what your water consumption actually looks like. But when you scale up the consumption of households to a DMA level, especially where there may be upwards of 1000 properties, very clear patterns can emerge depending on area, demographics or time period.
In this blog, domestic consumption patterns will be analysed to give a comparison through time, highlighting the causality between real world events and the impact they can have on how we use water.
For the majority of domestic DMAs, daily flow profiles broadly follow a diurnal profile, with peaks in demand occurring at around 07:30 am and 18:30 pm which coincide with households preparing for work/school and returning home and having an evening meal. There is natural variation between different DMAs which mostly depends on the demographics within the households; age, employment rates and number of children within a DMA can all introduce different demand patterns if they are present in enough households within an area.
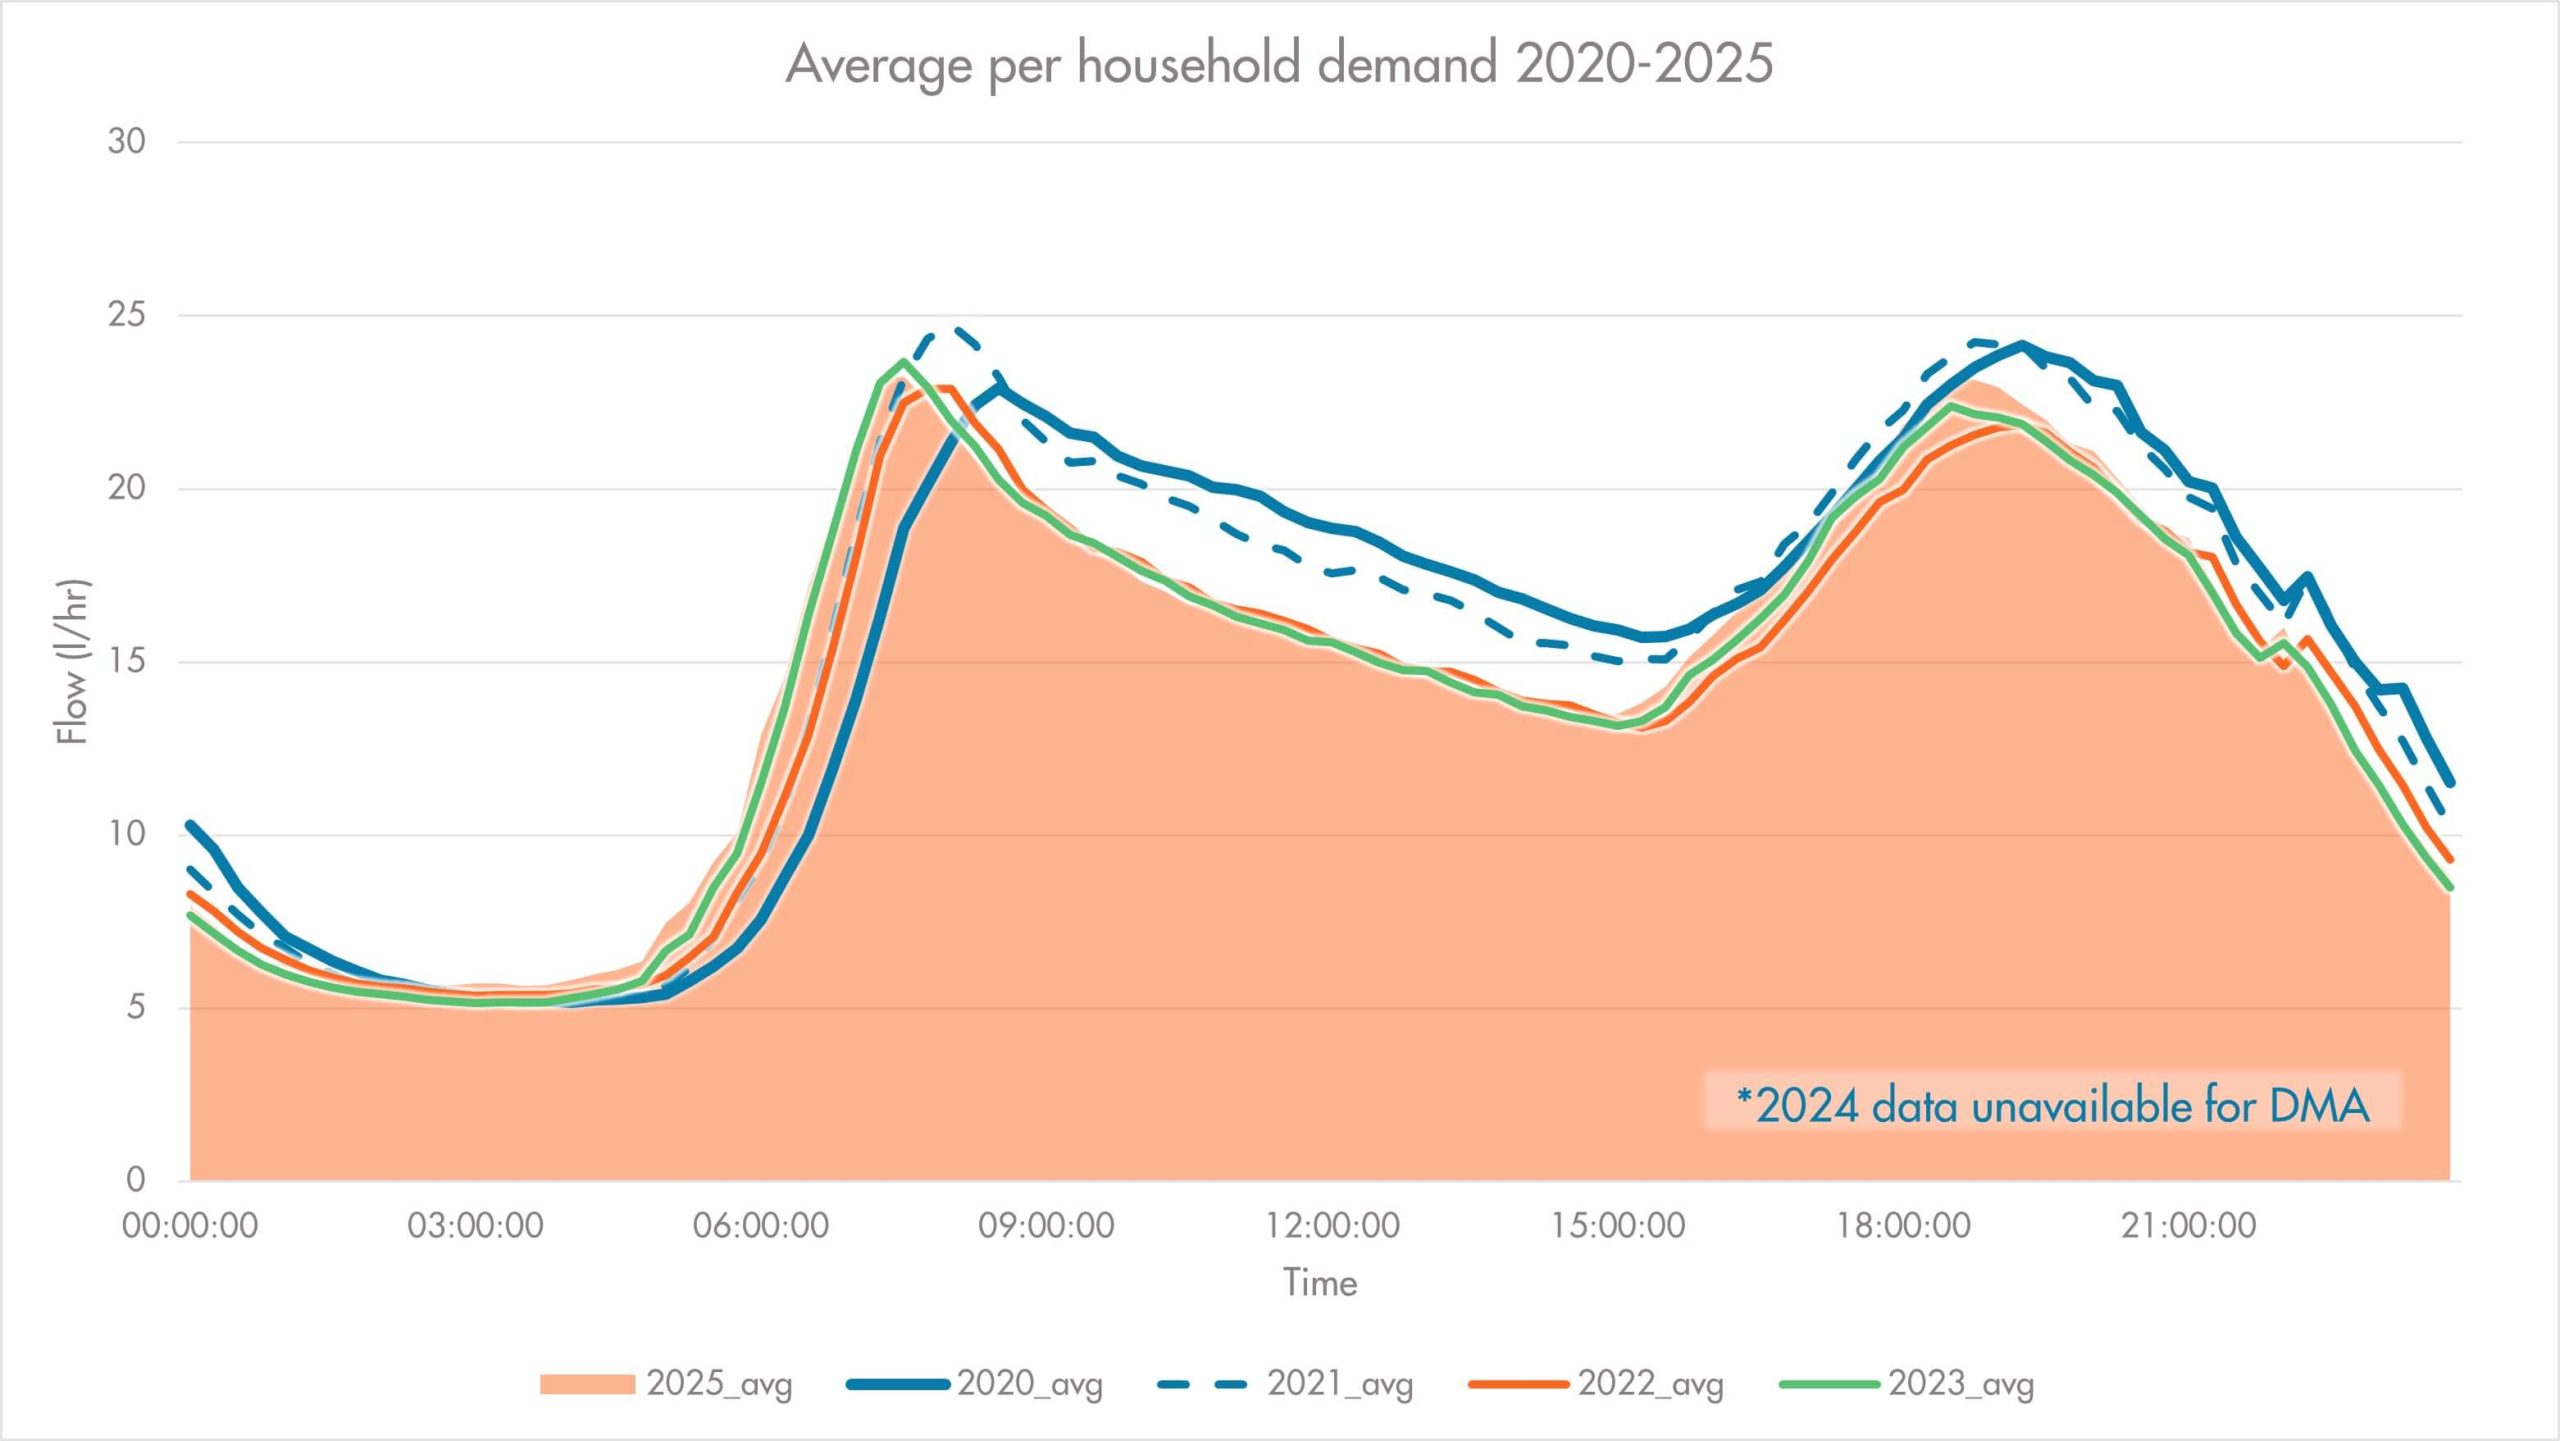
However, there are times where events can have an impact on domestic behaviour in all DMAs. In 2020, when the Covid-19 pandemic prevented all but the key-workers from leaving home during nationwide lockdowns and tiered restrictions, there was a notable shift in behaviours as the status quo shifted to the ‘new normal’. Working from home and home schooling had a major impact on the way households used water, with the lack of a commute or school drop-off meaning there was less rigid daily routines. This can be seen in figure i., where a DMA predominantly consisting of families and more affluent households saw a shift in demand. The morning and evening peaks became an hour later, with daytime demand increasing as more people remained in the house throughout the day
Figure i. Average daily demand 2020-2025 (1/hr)
Despite the increased daytime demand, the minimum night flow (MNF) period remained largely the same during Covid when compared to post-Covid years. This emphasises that changes to demand patterns were due to behavioural shifts rather than leakage or DMA network issues. By June 2020, 38% of UK workers were recorded as working from home full time, a figure that has dropped consistently year-on-year to 2025, where the value now sits at 13% (Statista). This gradual reduction in those working from home can be seen in Figure i. as morning and evening peaks return to where they would conventionally be expected, with morning peaks also becoming more pronounced when compared to 2020 data.
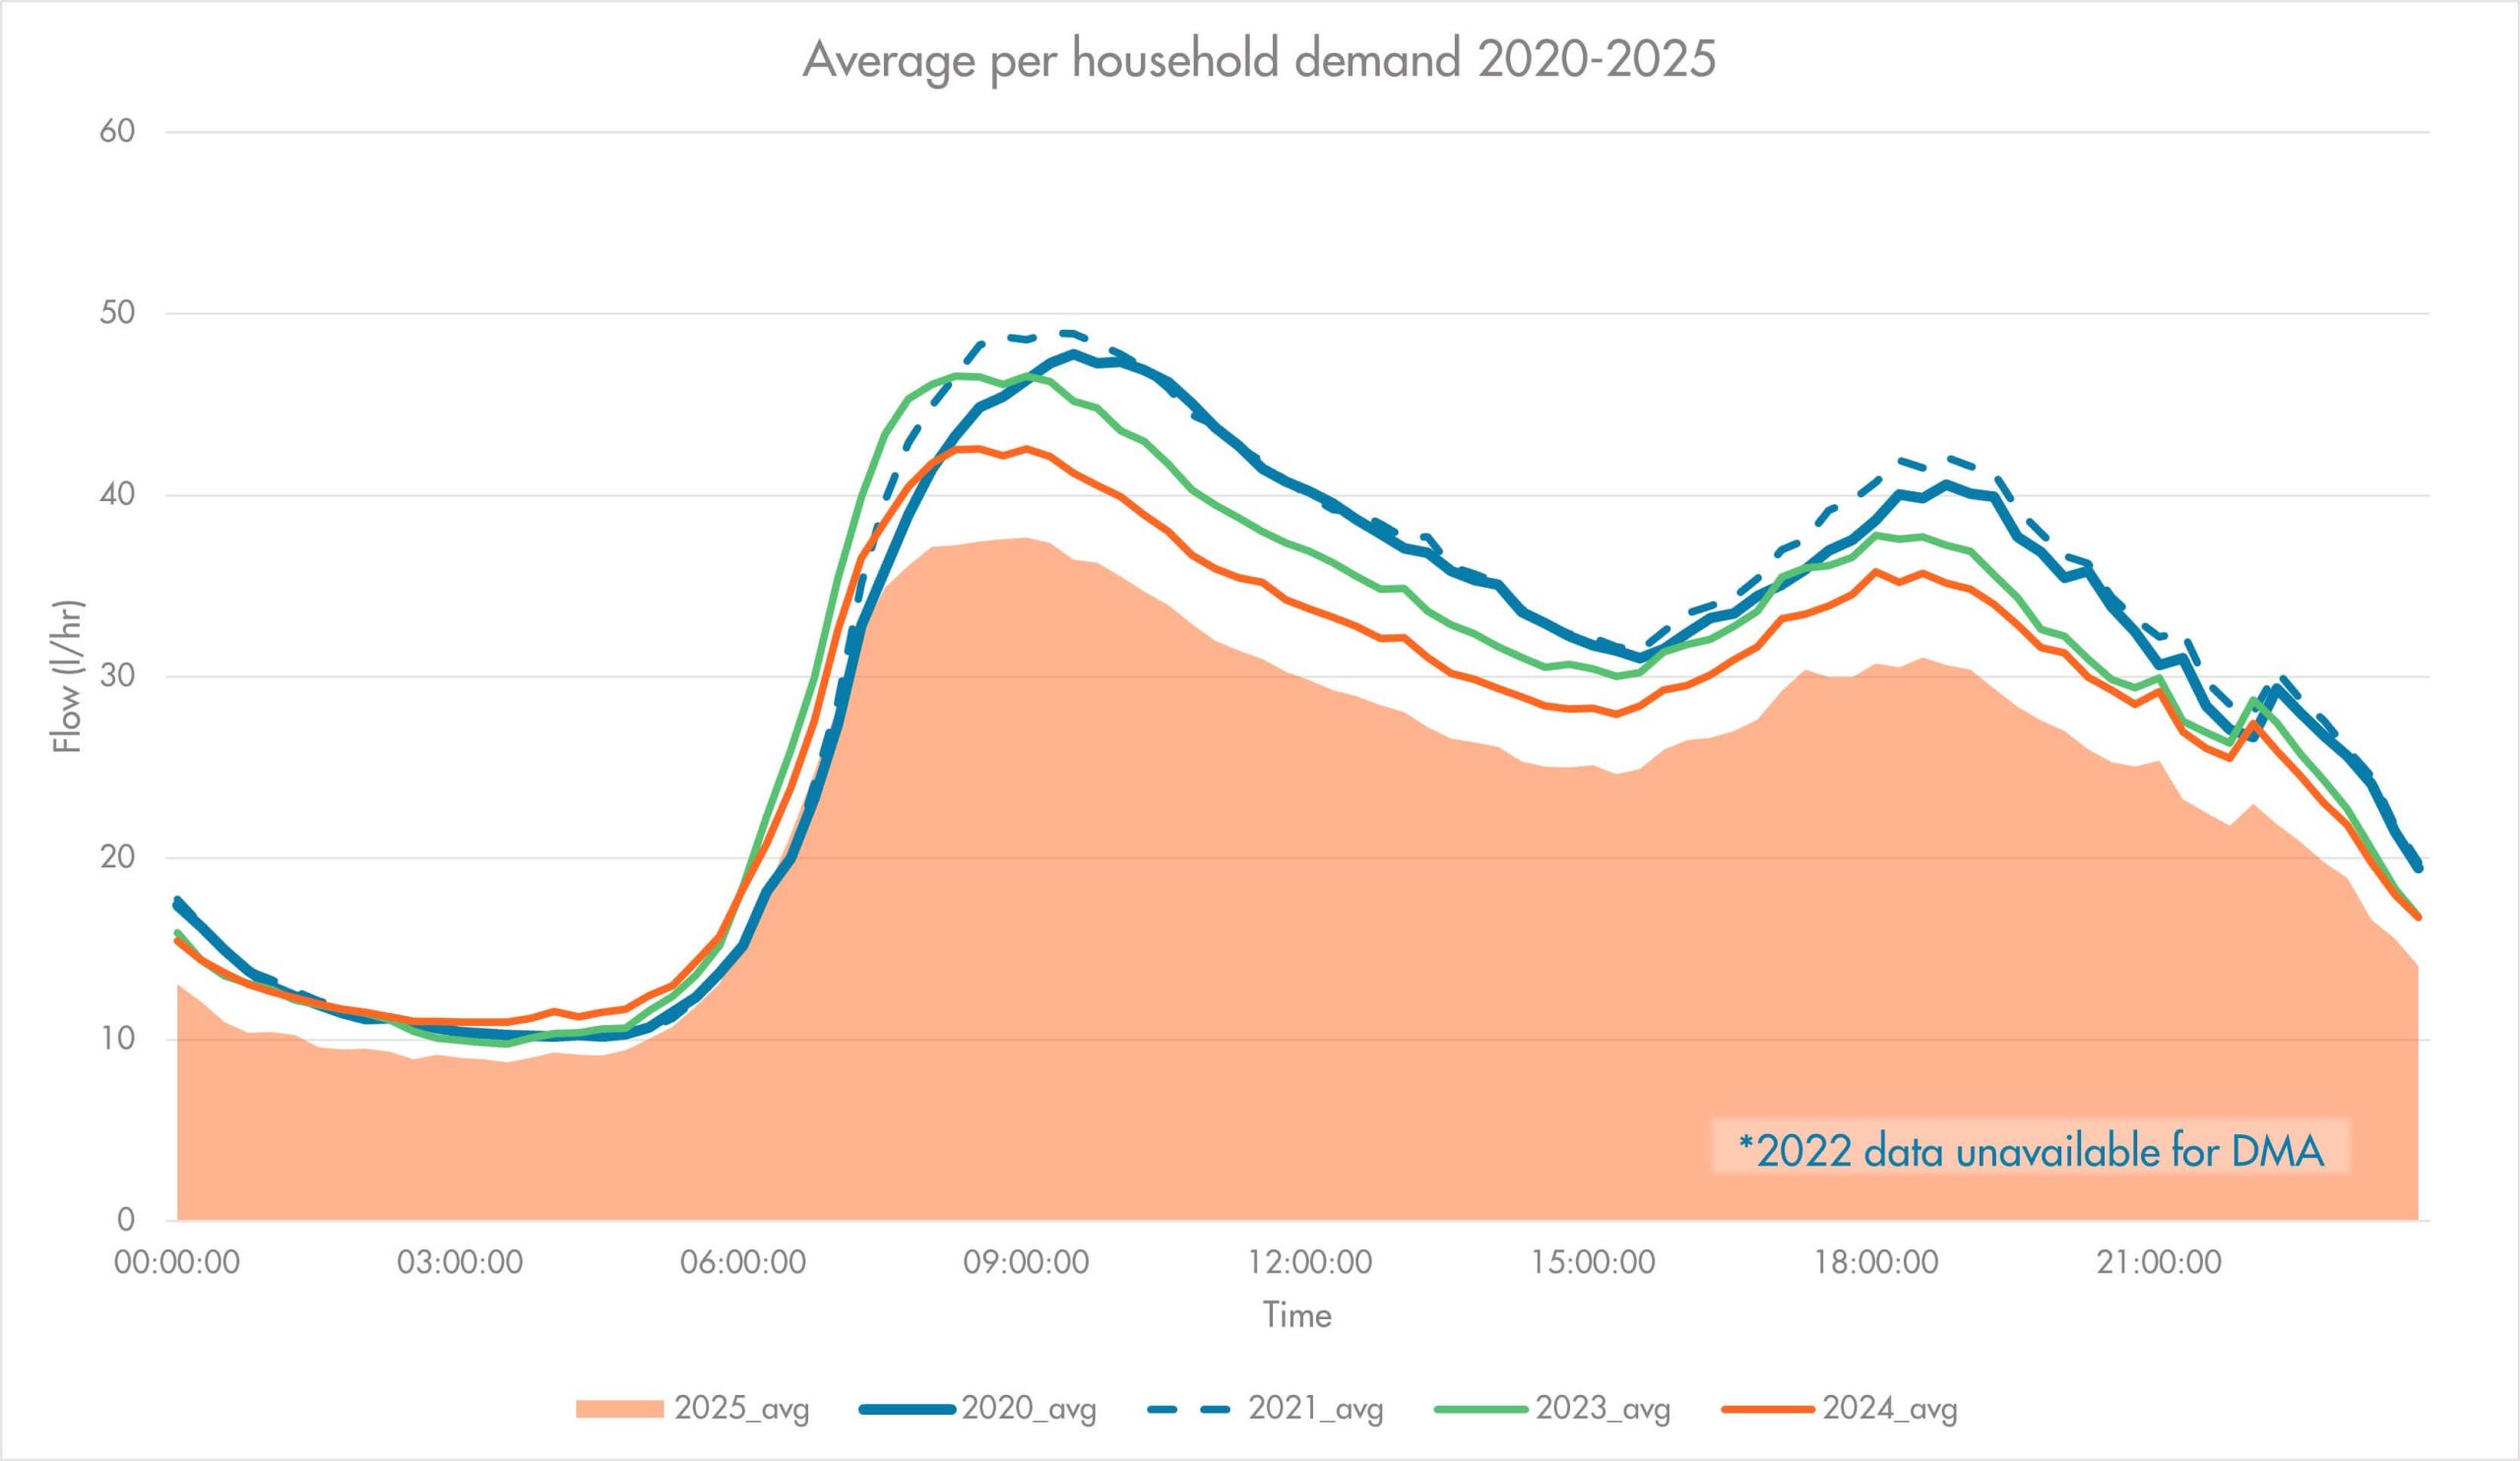
Similar trends are also observed in DMAs where the demographic leans more heavily towards older aged inhabitants; in Figure ii. over 60% of households are made up of either pensioners or families with older children (ONS), and again there is a clear shift in peak demand times and the volume of water being used during the daytime. In this case however, there is a less defined difference in evening peak time, suggesting that these household types potentially were less heavily impacted by behavioural changes triggered by working from home and reduced commuting times, and perhaps were impacted more by the inability to leave the house during the day due to Covid restrictions and health fears in the older population.
Figure ii. Older inhabitant DME demand changes 2020-2025 (1/hr)
Similarly to Figure i., there seems to be a gradual return to the 2025 demand pattern, where behaviours shifted back from what had become the ‘new normal’. Whilst it may feel as though our lifestyles have now well and truly recovered from 2020-21, there still are some aspects that are experiencing ‘long-Covid’. The National Transport Survey in 2025 found that commuting has fallen by over 20% since 2019, despite reaching a peak in 2022 where 60% of the workforce returned to in person working (Statista). Those taking trips out shopping by car/train has also seen an 8% reduction over the same period. This may play a part in explaining why in many DMAs we have actually seen a slight reduction in peak demand when compared to 2022 and 2023, even though the timings of these peaks have reverted to pre-Covid patterns.
The transition to a society that spends over 25% of the time hybrid working may have presented a new baseline of domestic demand in which, at the daily average level, not much seems to have changed, but when looking at inter-day relationships there may be more noticeable changes in demand trends.
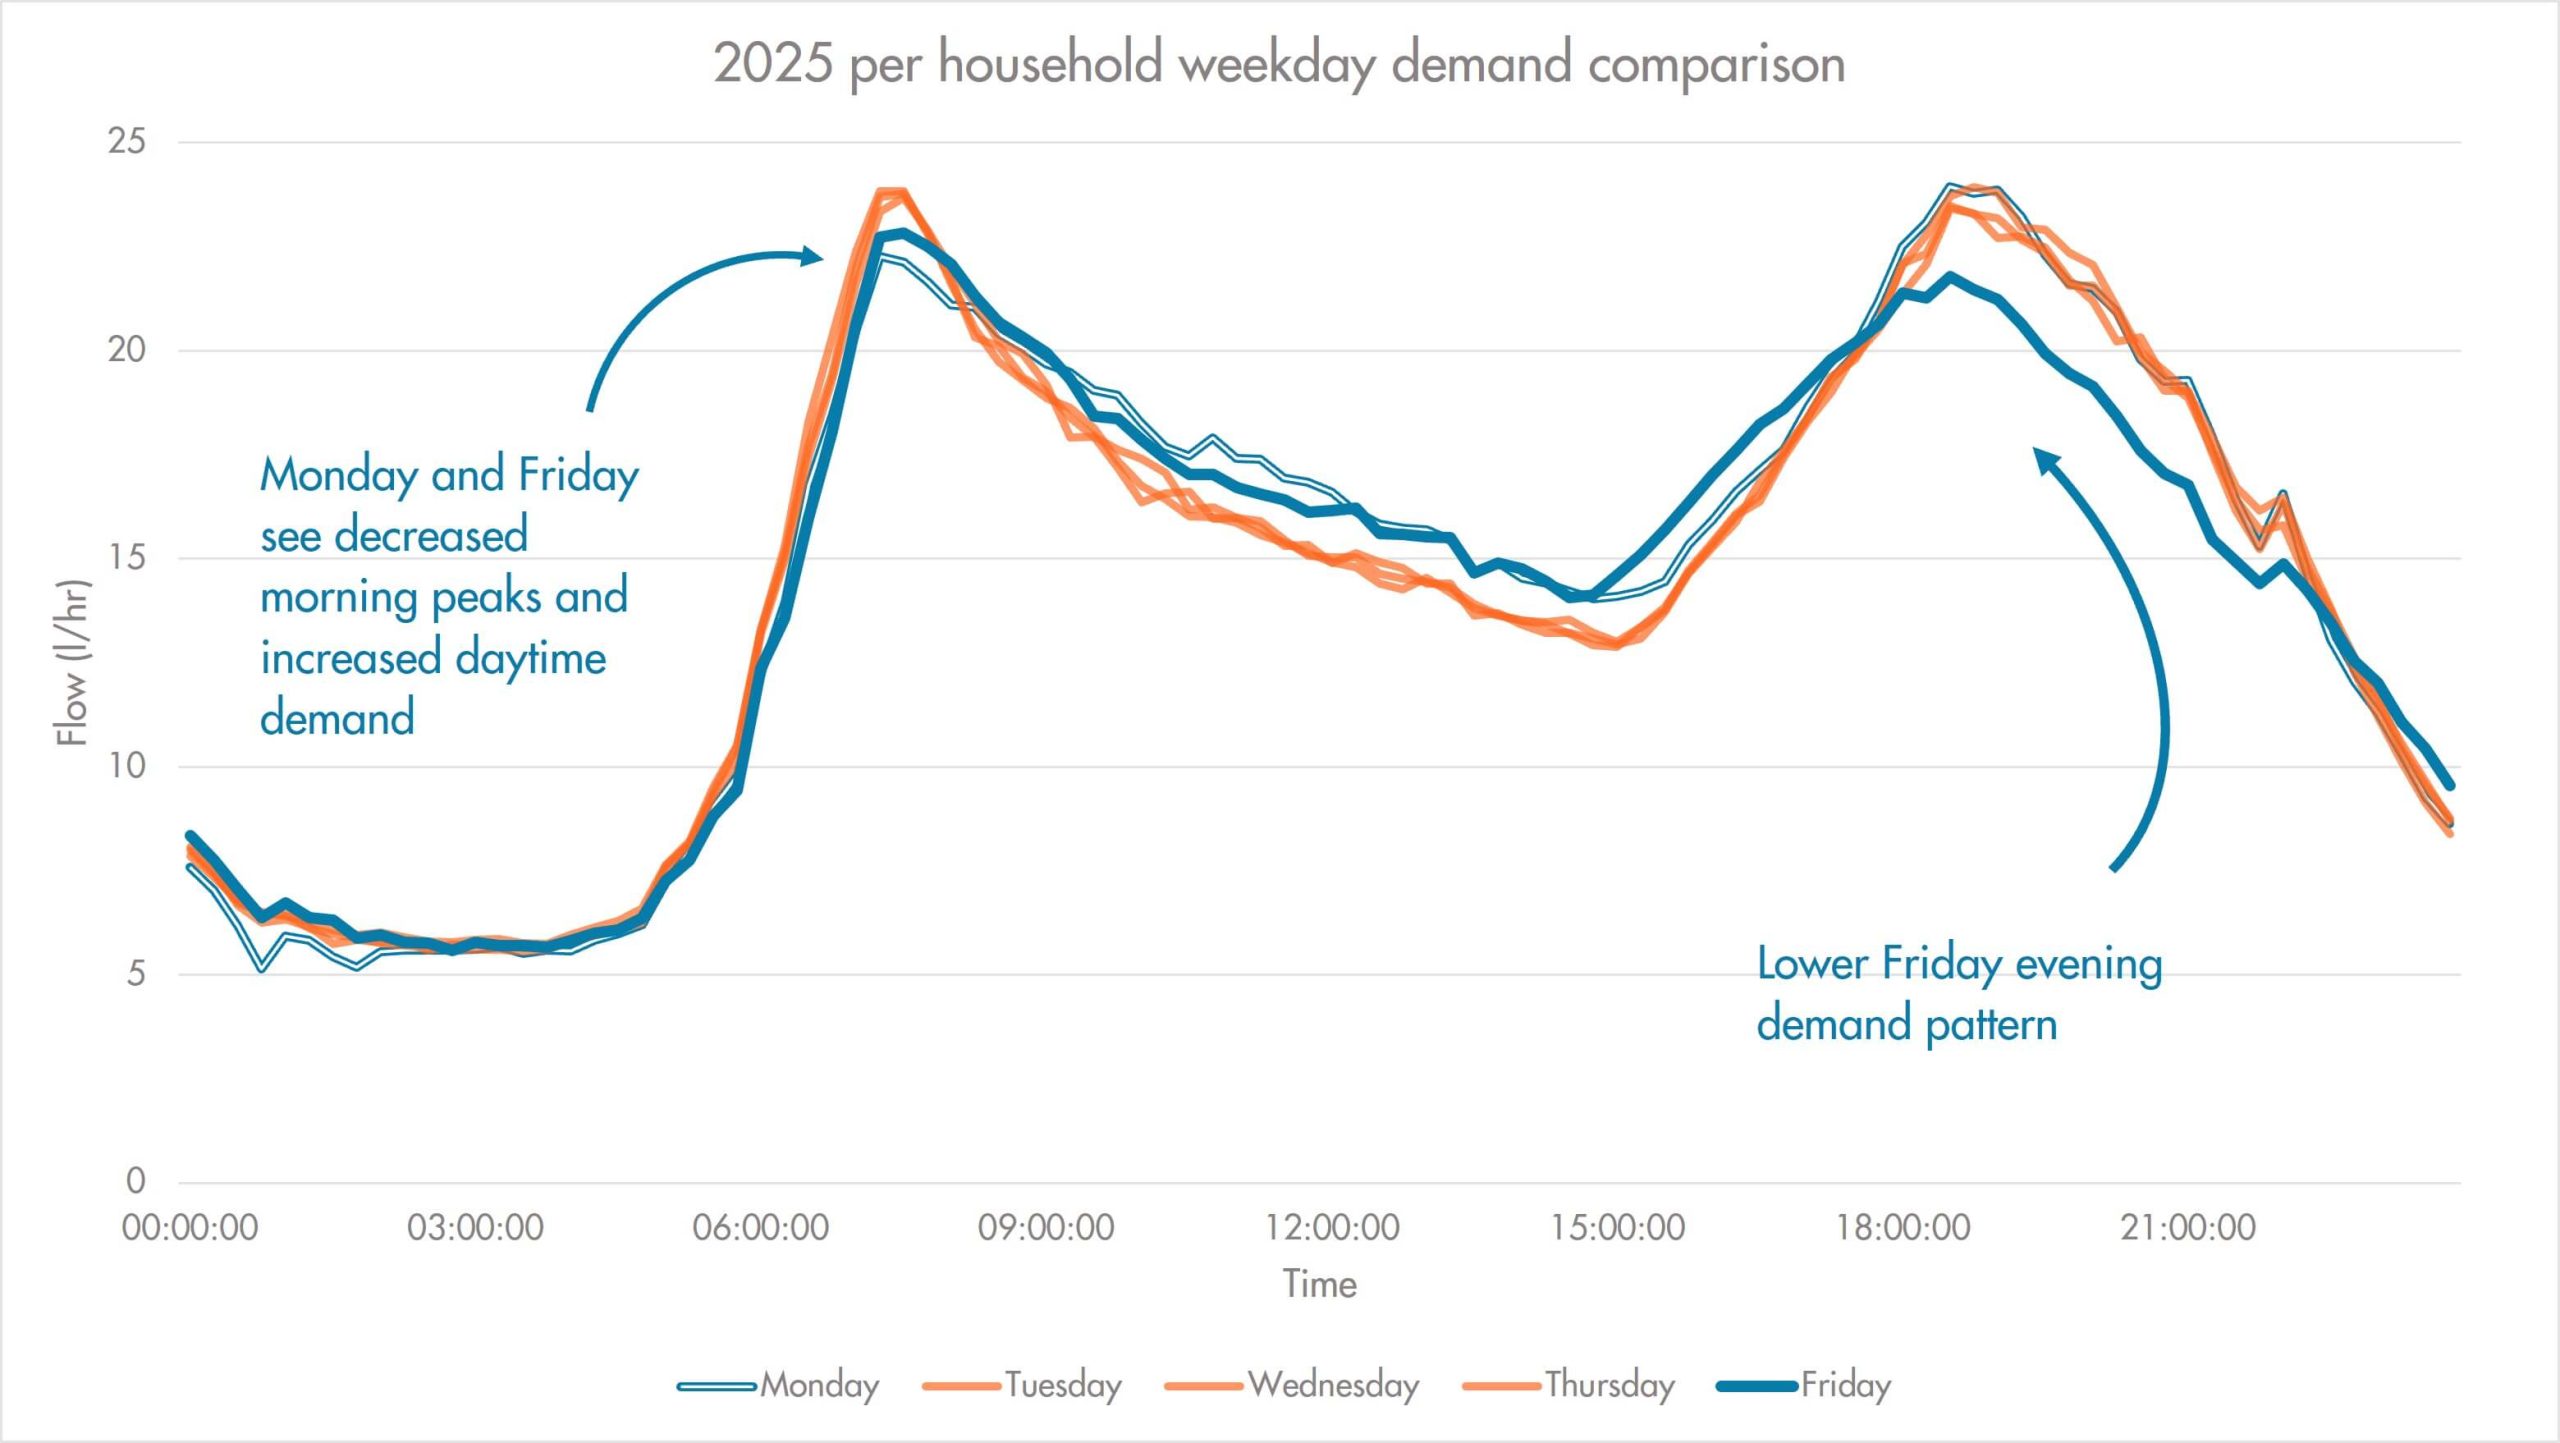
Figure iii. Weekday demand relationships (1/hr)
The DMA in Figure iii. has residents with a high level of employment and near the UK average number of children per household (ONS), so it would be expected that daily routines would be relatively consistent. However, Mondays and Fridays are observed as having some variation, with lower morning peaks, increased daytime demand and in the case of Fridays, much lower and slightly earlier evening demand patterns. This could be due to the number of hybrid workers in the DMA, with Friday typically seeing 65% of those who work flexible office days staying at home (ONS).
Whilst these variations tend to have a limited impact on reporting or targeting, and the overall demand in domestic DMAs has not varied greatly, it remains important that we understand how and where DMA demand changes over time. The Paradigm model relies on household groups being as accurate as possible in order to account for daily demand and provide a reliable expected profile to our clients. For this reason, we ensure that household demand is analysed regularly and the Paradigm model retrained where required, allowing for maximum focus on more pressing concerns such as boundary issues and emerging leakage. By providing up to date household profiles, we empower our clients who use Paradigm to tackle these issues with greater confidence.