
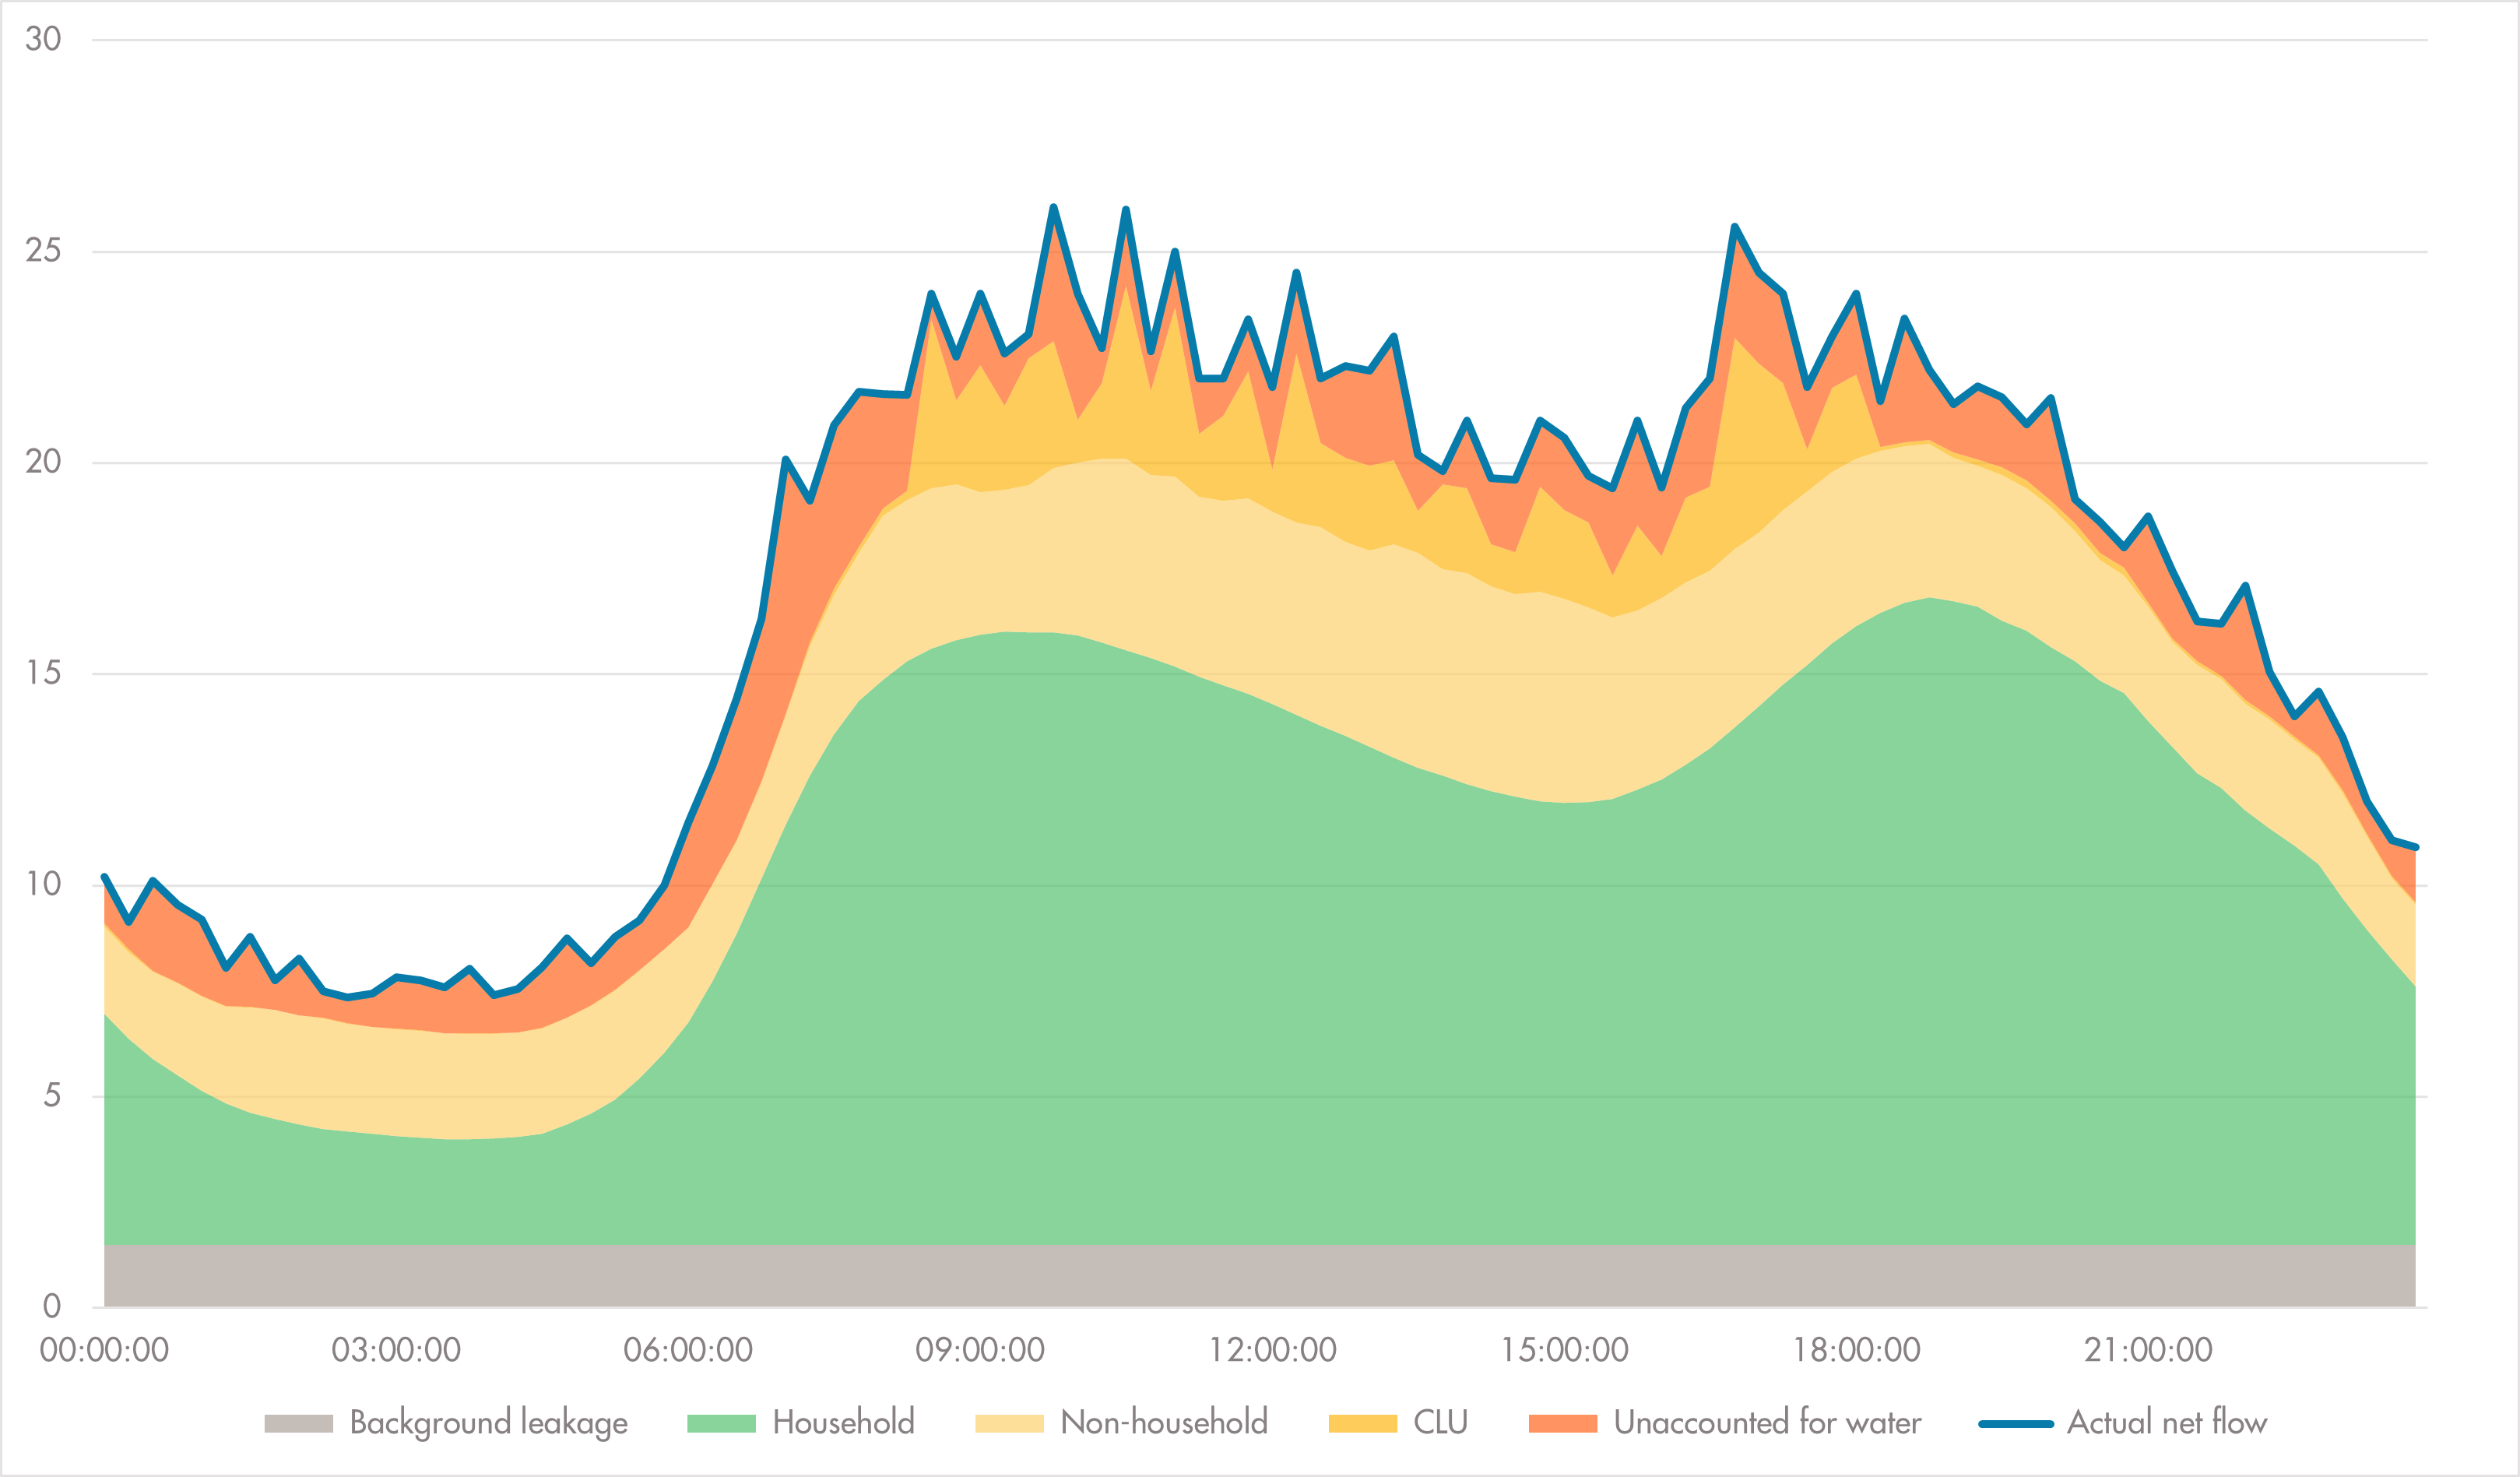
Below is an interactive graph that shows how Paradigm builds up its modelled profile.
Click the different components on the graph below to learn more about what they represent and how we calculate them. An explanation for each component will display below the graph.
Paradigm Components
Household
The Household component provides an estimate for the shape and volume of consumption by households in an area over the course of any given day. To do this, we have the most recent census data to build up a picture of the area’s population with particular reference to household occupancy, household income and age profiles. Once we have calculated the average DMA occupancy and level of affluence, we are able to assign an estimated daily volume for per household consumption (PHC) which we aggregate up using the number of domestic properties in the area to give an estimated DMA volume of consumption. This gives us a basic expected household profile for each area which we modify in a number of different ways throughout the year to account for changes in people’s behaviour. These modifiers include the obvious things like the difference between weekdays and weekends (including the difference between Saturdays and Sundays) basic seasonality and Bank holidays, as well as the more involved: such as local school term times nationwide, and the impact of student populations and Ramadan where applicable.
Non-household
The non-household component is the last that we calculate and presents a unique challenge. Where the shape of domestic consumption at scale follows people’s natural rhythms and volume is broadly dictated by the size of population, NHH consumption can vary widely in its behaviour; with nightclubs, office blocks, factories and Post Offices all falling into this bracket. Paradigm wrestles with this challenge with reference to DMA-level billed volumes.
Through close analysis of the gap between the sum of our other components and actual net flow, Paradigm utilises machine learning to attribute a certain volume to NHH demand throughout each day.
By analysing how the DMA has performed over recent weeks, Paradigm reviews the unaccounted-for-water and analyses the pattern of consumption that has not already been accounted for. On a weekly basis, it then estimates the volume that can be attributed to NHH demand throughout the week in light of the billed volumes.
So, for example, NHH demand is usually higher on weekdays than it as weekends in most DMAs when people are not working.
Background leakage
This part of the Paradigm graph relates to the expected background leakage than can be found in the area. While deate in the industry continues as to what is and what isn’t leakage that can be detected through normal leakage detection activities, the issue of quantifying weeps and seeps is one that has been addressed in broad terms by the industry with accepted ways of estimating how much volume this might represent. Paradigm uses industry standard estimates for its background leakage component that look at infrastructure condition as well as the number of connections.
CLU
The Continuously Logged User (CLU) component is the only one that uses actual flow data. CLUs are selected from among NHH consumers because they are, by their nature, large and often sporadic consumers of water. For this reason, we incorporate real CLU data into our profiles, as trying to predict their behaviour is not always possible and the impact they have on demand in an area is substantial. However, through reference to historical data, Paradigm is capable of estimating their consumption on the odd occasion that CLU flow data drops out or is not received for a short period. This is done so as not to distort the user’s impression of how much unaccounted for water there is in an area.
Unaccounted for water
Paradigm calculates unaccounted for water by subtracting the modelled Paradigm profile from the actual net flow at every timestep. This means that when the net flow sits above the modelled profile, we are left with a positive figure for UFW and when it sits below we have a negative figure, indicating there is either too much or too little water being consumed by the DMA. Variations in the shape of the unaccounted for water (UFW) over a day indicate the type of issue affecting an area. For example, if the UFW has a diurnal shape, we can infer that household demand is not behaving in line with expectations and investigate, while a consistent band of UFW would suggest a continuous flow in the area – a strong indication of leakage.
Actual net flow
Paradigm models are compared against the actual net flow in an area. The net flow is inclusive of CLU demand and so is defined as the sum of all outlet meters subtracted from the sum of all inlet meters.