As has been shared in a string of LinkedIn posts over the past couple of months, we at SME Water have been embroiled in our annual assignments for the first part of 2024. This year I wanted to develop some exploratory work that I completed in 2023, looking into how much soil type, soil moisture deficit (SMD) and climatic conditions can affect the rate at which UK water mains burst. To take the investigation further this year, I was keen to expand the range of DMAs being analysed as well as increase the detail of the soil and climate data used to test the relationship between bursts and climate.
The key questions I was hoping to answer throughout my investigation were as follows:
- Can a DMA be classified by the dominant soil type within its area in a way that can be of use to water companies?
- Is there a clear geographical difference between the effects of soil type and soil moisture deficit on burst rates in the UK?
- Can a rough model be created to show ‘expected’ burst rate increases in different areas during extreme weather conditions?
To answer these questions I have used mains burst data, kindly provided by several of our Paradigm clients, as well as soil moisture deficit figures from the Environment Agency and regional climate data on temperature and rainfall from the Met Office. I was also able to obtain a detailed soil-scape map from the European Soil Database Archive (ESDAC) that provided a 1:1,000,000 scale and extremely detailed background information on the soil characteristics that previously I had to estimate from general information.
This blog will highlight the methodology and process that I have used as well as sharing key outputs and findings based on my analysis.
My previous investigation centred around only a handful of DMAs from a single client, however this year I received burst data and polygons for over 8000 areas. This breadth of data coupled with having two years of historic bursts to link to the DMAs meant that setting up a well-structured database was a necessity. By creating a database I was also able to use PostGIS to store both the DMA polygons and UK soil polygons, which would come in very handy when it was time to conduct spatial analysis.
The client data I received also spanned a wide geographical area, spreading from Hartlepool in the Northeast, down to Gloucestershire and Chelmsford at its Southern extent and so required far more climate and SMD data compared to my original investigation. I extracted Met Office weather station data for six locations that covered the majority of my DMA sample; this data included maximum and minimum temperatures by month, monthly rainfall (mm) and percentage of rainfall against the long-term average. For the purposes of my analysis, I aggregated SMD data from more localised 40km grid level up to a broader region level, taking average values calculated using the grid data. Utilising these datasets allowed me to improve my accuracy when analysing the effect of climate and SMD conditions across the country. Using individual weather stations and regional SMD values I could use spatial analysis to ‘snap’ each DMA to its nearest weather station and region. This then allowed me to analyse the effects these changing conditions had on localised soil types and compare these outputs against different regions or client areas.
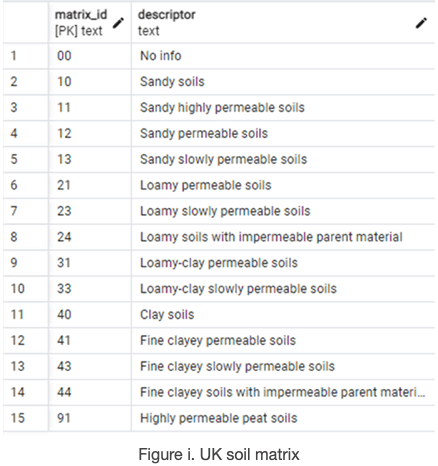
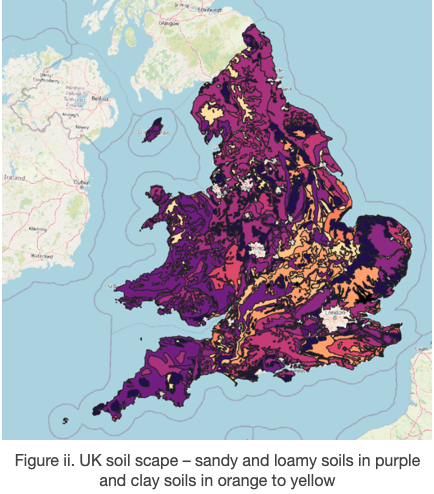
The use of spatial analysis techniques in PostGIS first required some transformation of the ESDAC soil data I had downloaded. Whilst this data is extremely valuable and holds a great deal of useful information, for the purpose of this investigation I thought it would be best to create a simplified subset that cut down the categories of soil from over 100 across the country, to a more palatable number relating to key soil characteristics that would be of use to clients. Therefore, I created a soil matrix based on the particulate makeup and underlying permeability of the soil, which provided fifteen categories (Fig i. & Fig ii.)
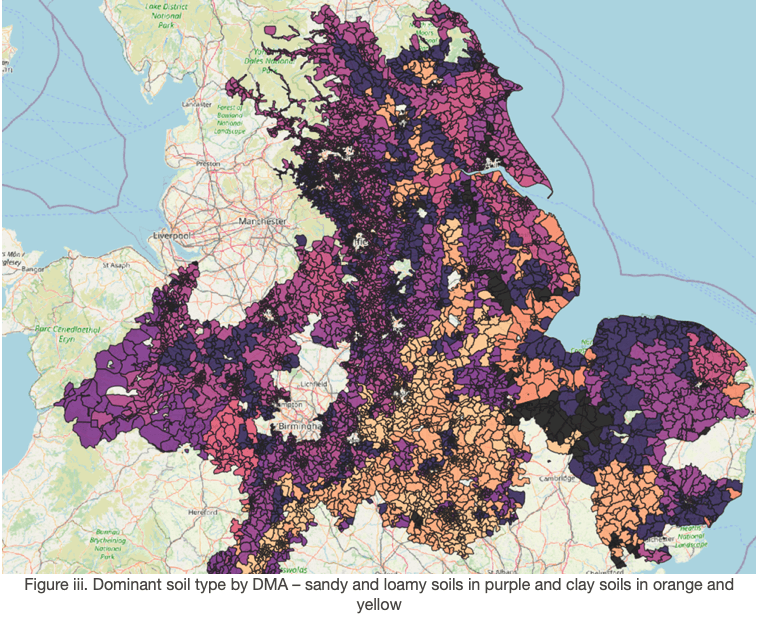
To derive a DMA’s soil type, I used PostGIS to analyse the relationship between the client DMA polygons and soil matrix polygons, running a query that looked at where a DMA intersects, overlaps or is within the bounds of a soil type. From there I could work out the percentage of each DMA’s surface area taken up by a particular soil and create an output that returns only the soil with the greatest proportion present in a DMA (Fig iii.). By doing this all DMAs within each client dataset were assigned a soil type within my database, relating to key characteristics likely to be found in that area; something that could be very useful for water companies when trying to understand trends in bursts during different climatic conditions.
The findings from this activity showed a wide variation in soil types across different clients. The Northeast has a large proportion of loamy soils with impermeable parent material; these soils have a far greater ability to retain moisture, especially through hot dry conditions. They may also experience greater deformation during freeze thaw events due to the high level of moisture. Conversely the more Eastern DMAs see a greater proportion of fine clay soils with a more permeable parent material, these soils theoretically should dry out faster and deform during hot weather, possibly causing more bursts during these periods.
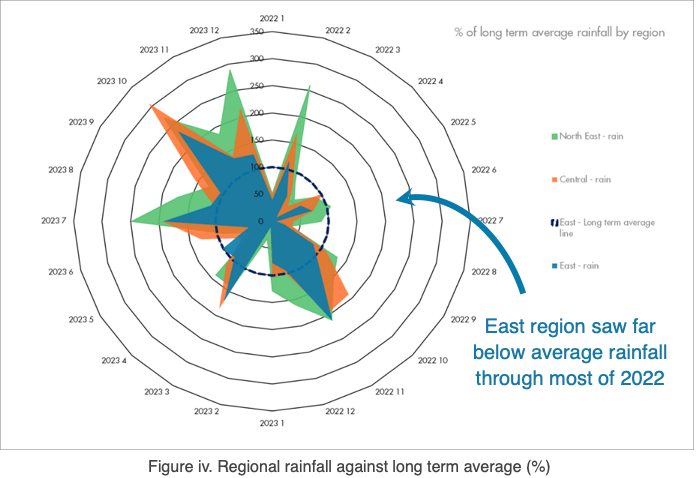
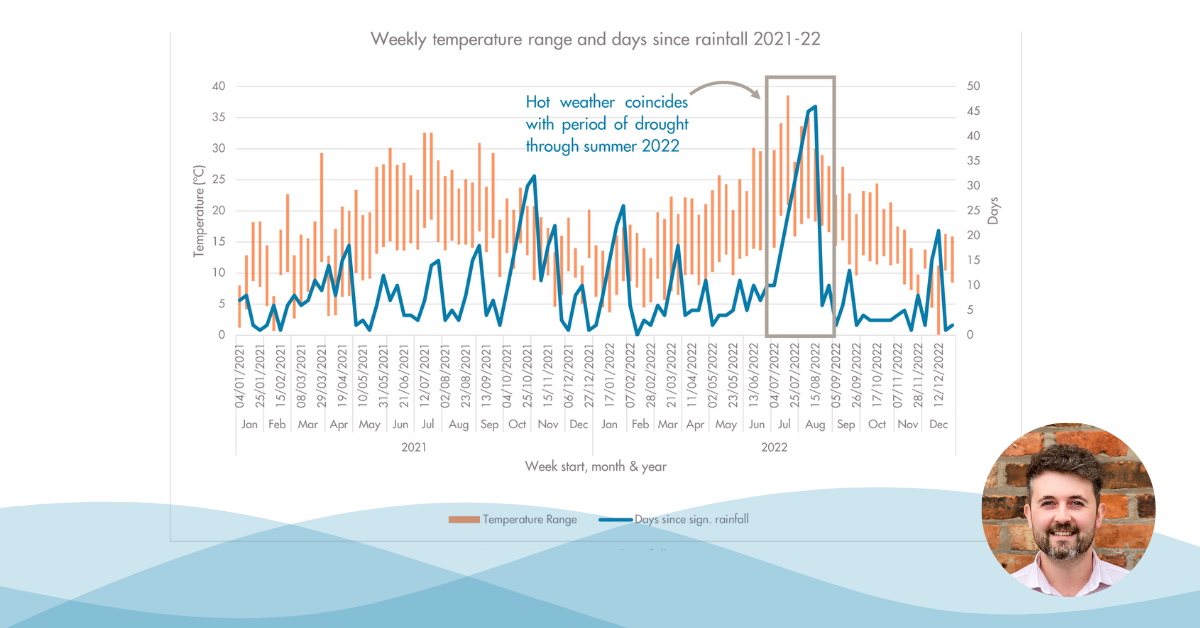
To analyse whether these assumptions are true, I used these newly categorised DMA soil types and matched them to the historic burst data provided by the clients. I used 2022 and 2023 data as there were clear differences in climatic conditions between the two years, with 2022 seeing record heat and drought conditions and 2023 being far wetter particularly through the back end of the year (Fig iv.).
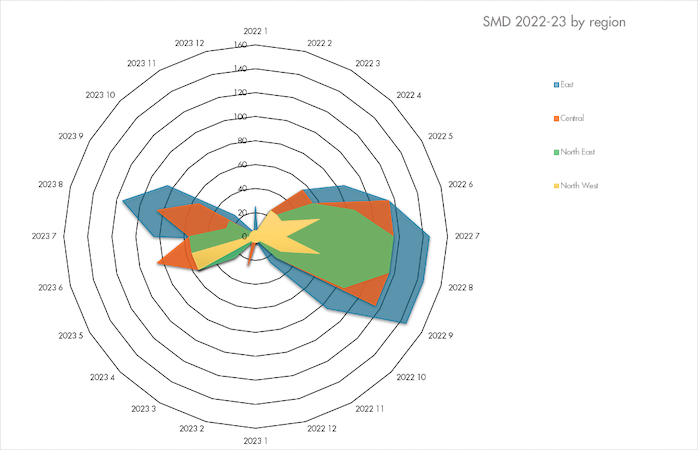
The SMD values for the same regions mirror the pattern in rainfall over this period too. Where the minimum rainfall occurred across the East SMD increased greatly, extending through the whole summer period. The Northeast and Central regions also saw an increase in SMD, though to a lesser extent due to marginally higher rainfall values across the period. 2023 saw far lower SMD levels through the whole year as rainfall was widespread and, for the most part, consistent throughout the year (Fig v.).
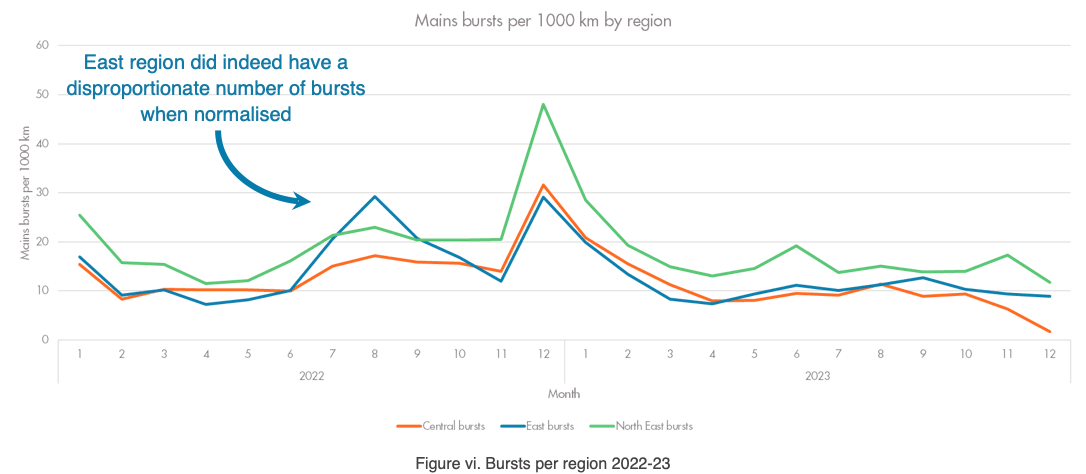
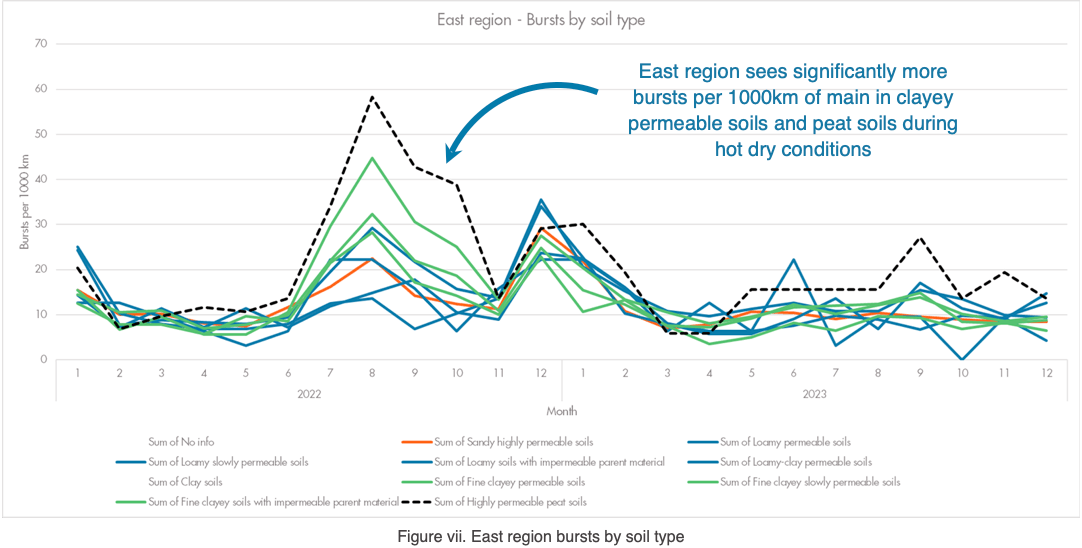
Having analysed the relationship between climate, SMD and soil type by matching DMA polygons with burst data I could then begin modelling the outputs, first showing the impact on bursts between each region throughout 2022-23 (when normalised by mains length) in Figure vi. Here it was evident that despite all regions experiencing an increase in bursts during the freeze thaw event in December 2022, there was a significant upturn in bursts within the East region in Summer 2022 that correlates with the lack of rainfall and increased SMD. I was interested to see whether this increase in bursts during the hot dry conditions could be attributed to the more permeable clay-based soils as I had previously assumed based on last year’s work. To test this, I modelled the normalised burst values in the East against their dominant soil type to see whether particular soils were the main cause of the bursts. This provided very interesting insights (Fig vii.), with peat and clay soils seeing a far greater number in bursts during this period, even more so than during the winter. When this same technique was copied in the Central and Northeast regions, it was evident that the number of DMAs that are clay dominant in a region, coupled with the climate and SMD conditions, has a bearing on burst frequency. There were less bursts in the summer in Central DMAs, and even fewer in the Northeast. The Northeast also experienced the most bursts during the freeze thaw event, with these predominantly occurring in peaty or loamy soils that held onto moisture more efficiently.
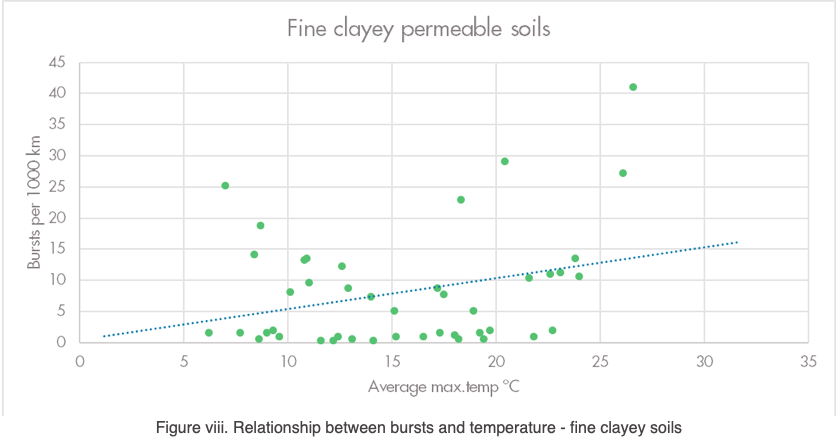
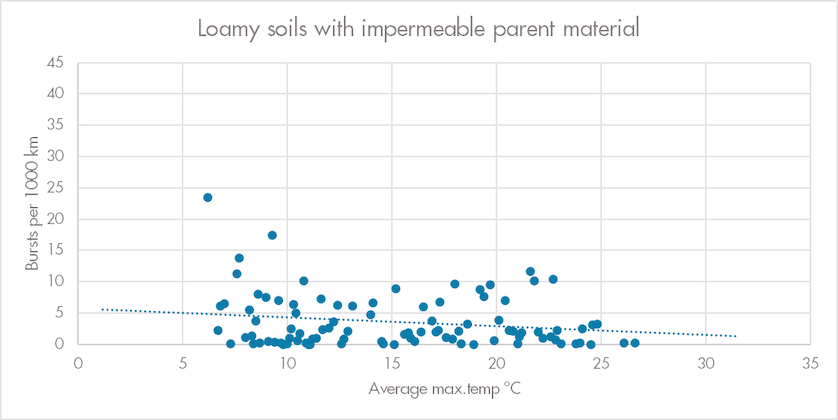
The final question I wanted to investigate was whether there was a way to model a simple expected impact on bursts through different climatic conditions. I analysed the effect of temperature by soil type as I felt that temperature was a more reliable gauge to use against burst data across the country, rather than rainfall or SMD which can be affected more by regional conditions. By inputting this data into scatter plots I was able to see the relationship temperature has on mains bursts within different soils. Having plotted these relationships, the outputs demonstrated that the peat and clay soils saw a far greater chance of bursting once the maximum temperature exceeds 25 degrees Celsius, but also showed an increase in bursts during the colder winter temperatures. On the other end of the soil spectrum, the soils with loamy and sandy particulate and especially those with an impermeable parent material, saw little to no increase in bursts through hotter temperatures, but had a greater increase when maximum temperatures dropped through winter. Figures viii. and ix. show the extent of the change in behaviour from clayey highly permeable soils to loamy impermeable soils.
Overall, I feel that this investigation has fulfilled the majority of aims that I had set. Through expanding my source data, utilising and learning new skills in PostGIS and spatial analysis, and transforming data into more manageable formats I have been able to create outputs and insights that, though relatively simple, could help to explain trends in water main bursts across the UK. By creating soil classification using key characteristics that affect soil deformation I have been able to assign DMAs to dominant soil types, something that may be of use as reference when planning or searching for seasonal leakage. I have also made progress in answering whether there is a geographical impact on the number and location of bursts, governed by the underlying soil type and climatic conditions. This is demonstrated by the more eastern DMAs experiencing a very different burst pattern that correlates well with rainfall, temperature and SMD values. I’m pleased to have been able to create a rudimentary model that can outline the expected burst trends in different soils, depending on maximum temperature.
There are of course limitations to this investigation, and I feel that to really understand the effect of soil type and climate there should be a focus on the pipe material and installation depth. Both are factors that can greatly impact the likelihood of mains failure at different times of the year, but for this study were a level of detail that would have taken far too long to explore. There is also a lack of soil data for heavily urbanised areas as extensive tarmac and concrete coverage has hidden the underlying soil; this means that my investigation was unable to take into consideration some of the most important areas for UK water companies when targeting leakage and planning resource. However, I think the data I received from our clients has shown that the trends and insights could be extremely useful in better understanding the changes in burst rates through changing climatic conditions and soil types.