Background
As has been well documented in the media, 2022 has been a year of extreme climatic conditions in the UK. Numerous records have been broken, creating a ‘perfect storm’ of issues for many of the water companies across the country. July became the driest on record in England with much of the country seeing below 40% of its average rainfall for the month, with 11 of the 14 Environment Agency areas being put into drought measures through July and into August. Coupled with this drought event, there have also been record high temperatures this summer, as well as several prolonged ‘heatwave’ events that have had a dramatic effect on water consumption.
Water companies have recently come under fire from customers and the press, especially around published leakage figures and management of demand incidents such as heatwaves. With more extreme climatic conditions set to become more frequent in the future, plus an inevitable rise in demand due to population increase, it will become more important for water companies to better understand which of their DMAs have a high sensitivity to changes in climate. Identifying key areas that react more drastically to hot/dry weather and understanding what characteristics these DMAs share, could prove extremely beneficial for future incident planning.
This blog will investigate how climatic conditions can affect DMA net flow and whether trends can be used to categorise DMAs based on their sensitivity to changes in climate.
DMA net flow vs. climate
It’s probably not very surprising to find that with increased temperature and low levels of rainfall, the demand for water increases. There can be multiple reasons for this upturn in demand, whether it stems from household customers watering plants and filling paddling pools, or non-household customers such as farms and garden centres requiring more water during dry conditions. There are also external influences and changes in behaviour that can magnify the issue. For example, school summer holidays, where household consumption is expected to rise anyway, can accentuate the effects of hot and dry weather especially during the day.
The difficulty lies is in understanding where the thresholds for these increases in demand are, and how many different types of DMA behaviour a water company may have within its customer base. To better understand the trends, I have taken a sample of 300 client DMAs and compared daily net flow values to the maximum daily temperature and days since significant rainfall (>1mm per day) throughout the year.
Temperature data
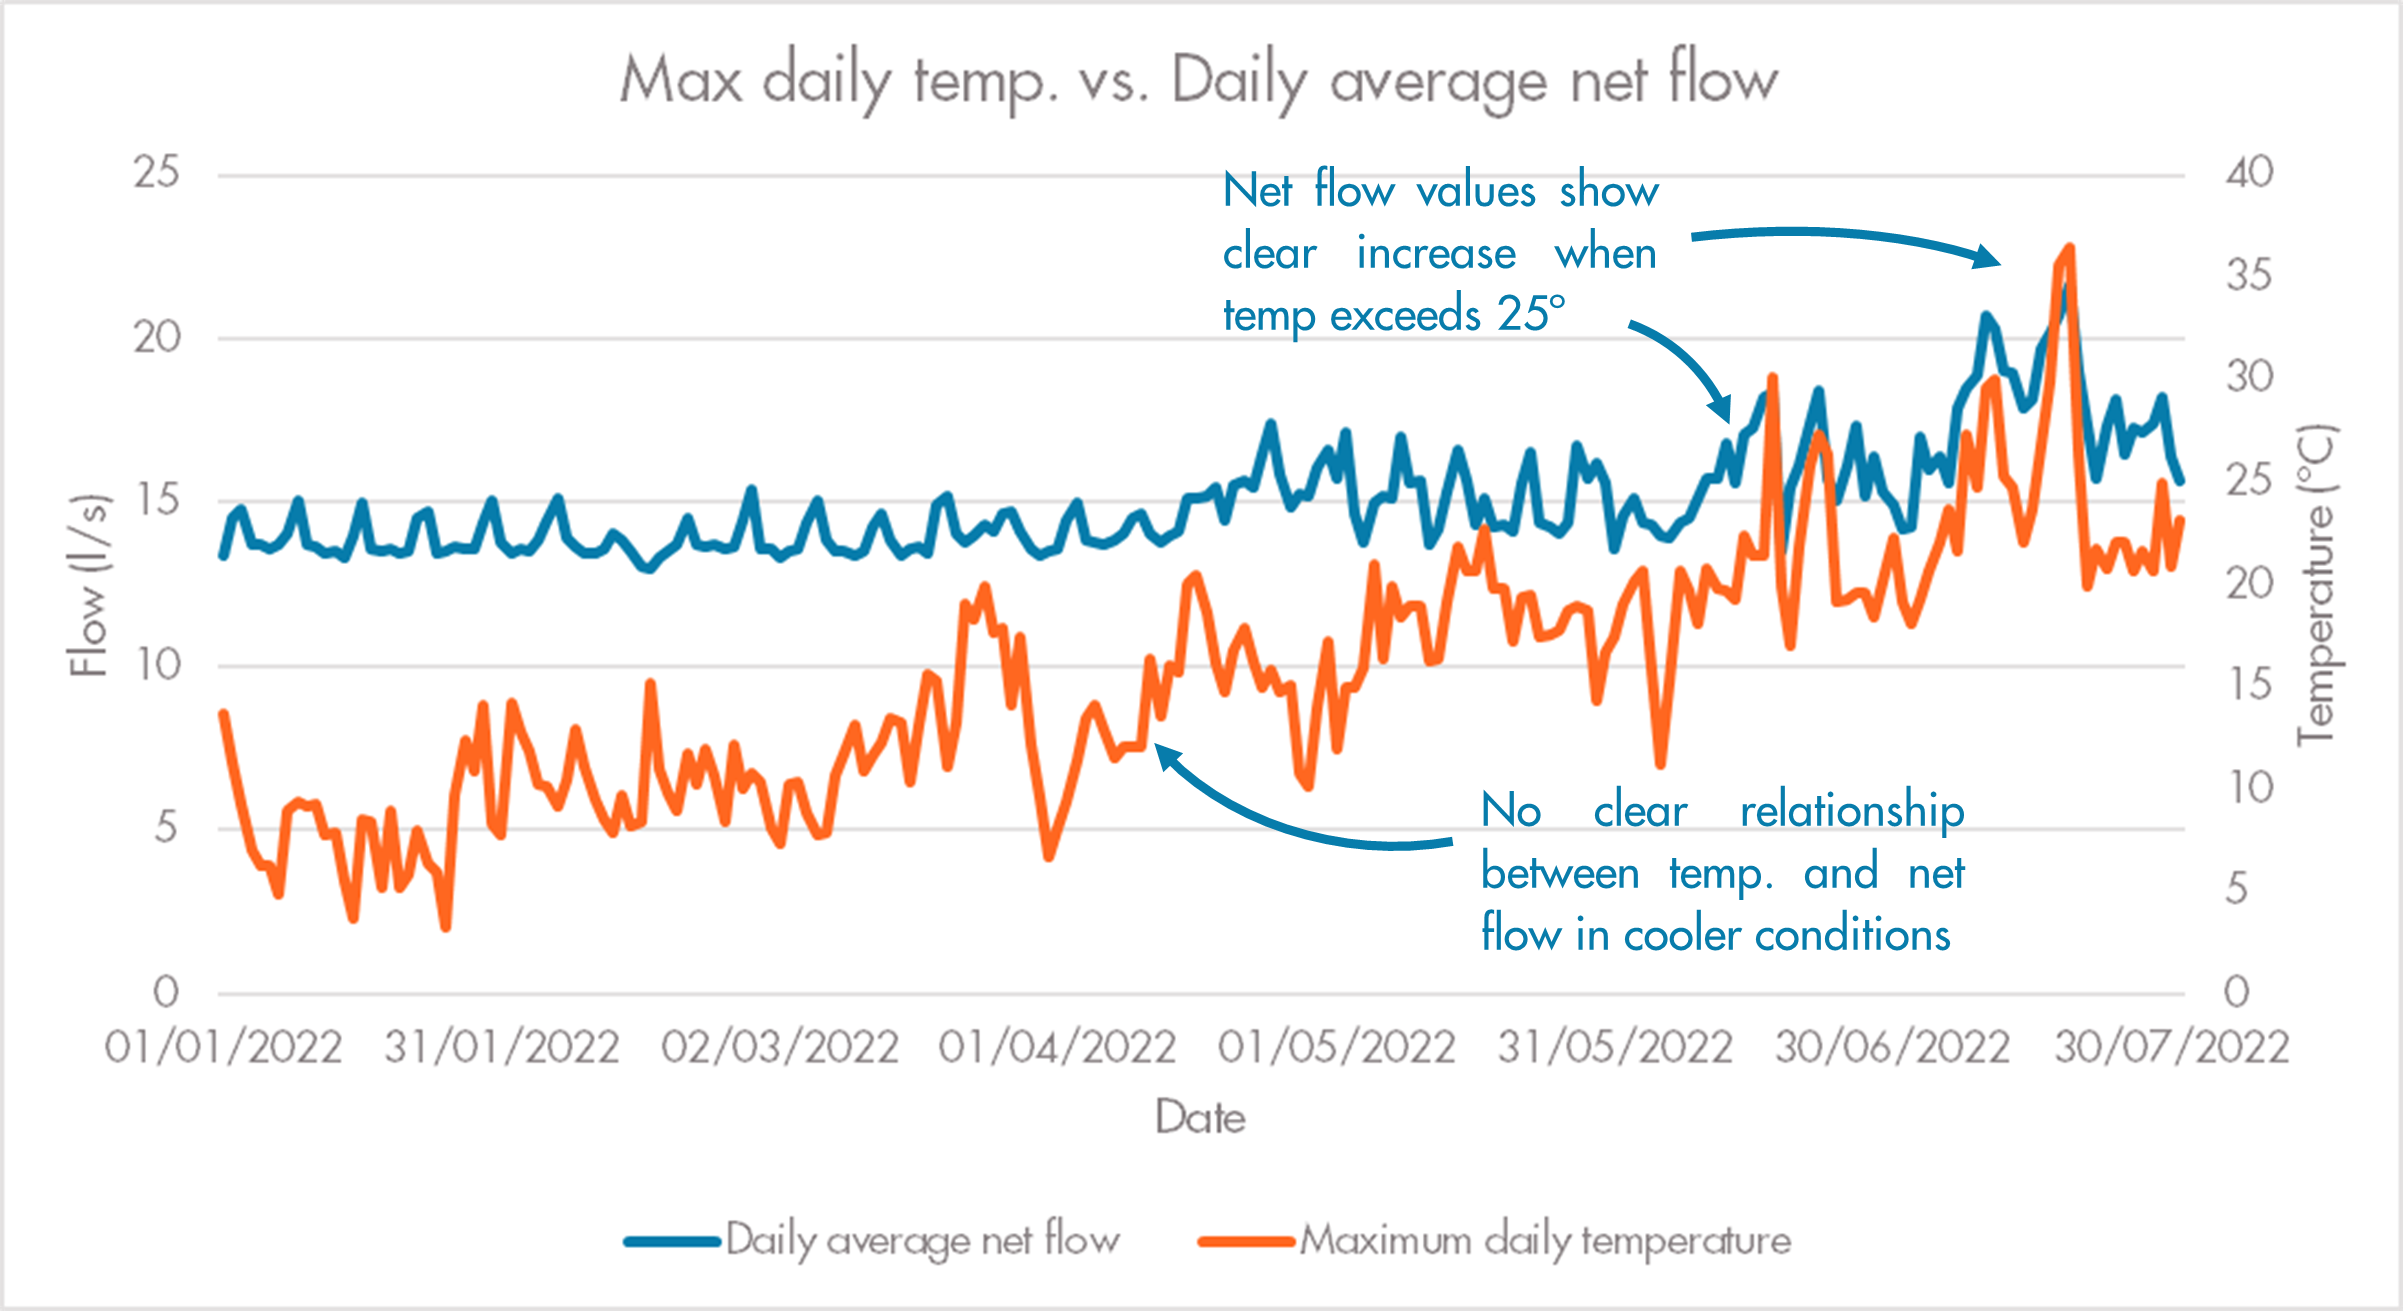
Through this initial investigation, it was observed that many DMAs that have high proportions of household consumption (>90%), began to show sensitivity to hot weather once the maximum daily temperature exceeded 25 degrees. In these conditions the increase in demand correlates closely to temperature peaks, whereas across the rest of 2022 there is no noticeable relationship between average daily net flow and maximum daily temperature (figure. i). This would suggest that one of the thresholds for water companies to look out for when monitoring possible incidents, is the effect of above average temperatures on predominantly household DMAs.