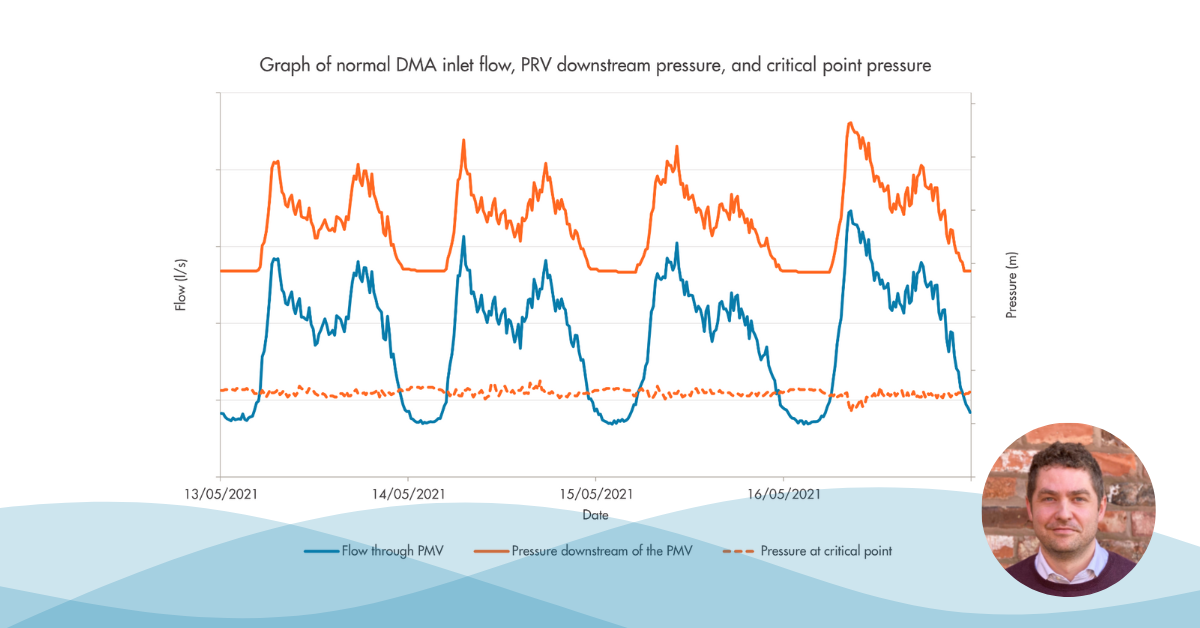
When analysing DMA net flow data, it is important to understand how variable diurnal net flow profiles can be in order to model them as accurately as possible. A clear understanding of which DMAs have consistent and repeatable net flow profiles gives us greater confidence when deriving expected profiles to identify abnormal events on the network.
To categorise DMA net flow profiles into those that are ‘consistent’ and ‘inconsistent’, we recently conducted a research project. Our goal was to determine what factors were vital in determining whether a net flow profile can be considered ‘consistent’ and ‘repeatable’. Once this had been ascertained, we hoped to use this analysis to understand what proportion of DMAs fell under each category.
When trying to determine what made a net flow profile ‘consistent’, we looked at several statistical measures. We discovered that a normalised measure of variation in the daily range, and specifically the morning period, produced a model that could help sort the DMAs into the two categories mentioned above.
Consistent net flow
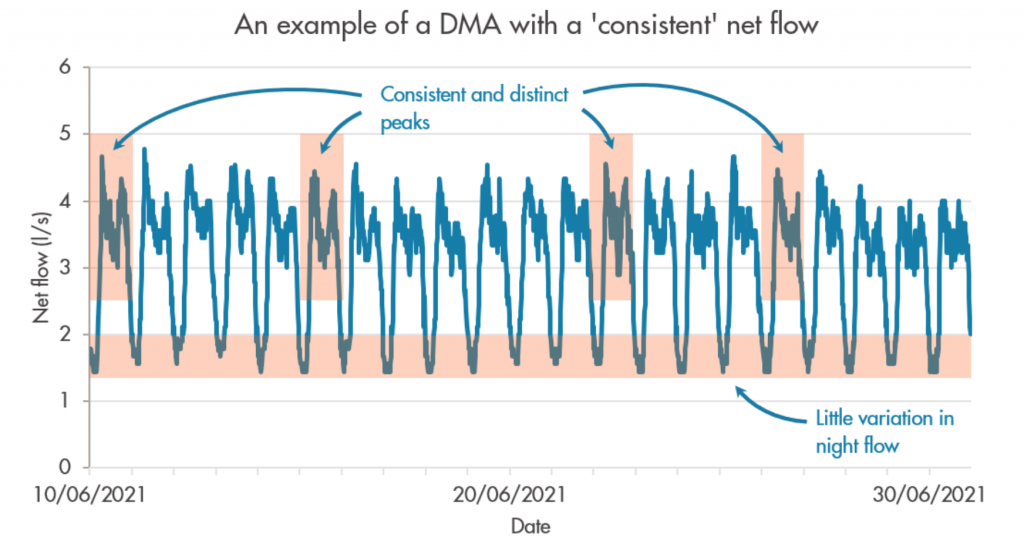
Figure 1: An example of a DMA with a ‘consistent’ net flow
Figure 1 shows an example of a DMA with a ‘consistent’ net flow. The DMAs that demonstrated greater consistency had a distinct repeated diurnal profile with two distinct peaks and very little variation across the period. They also had very little variation in flow during the night. Therefore, if there were a deviation in flow in any of these DMAs, we would be confident that it was the result of a genuine network event and would therefore warrant some form of action.
Inconsistent net flow
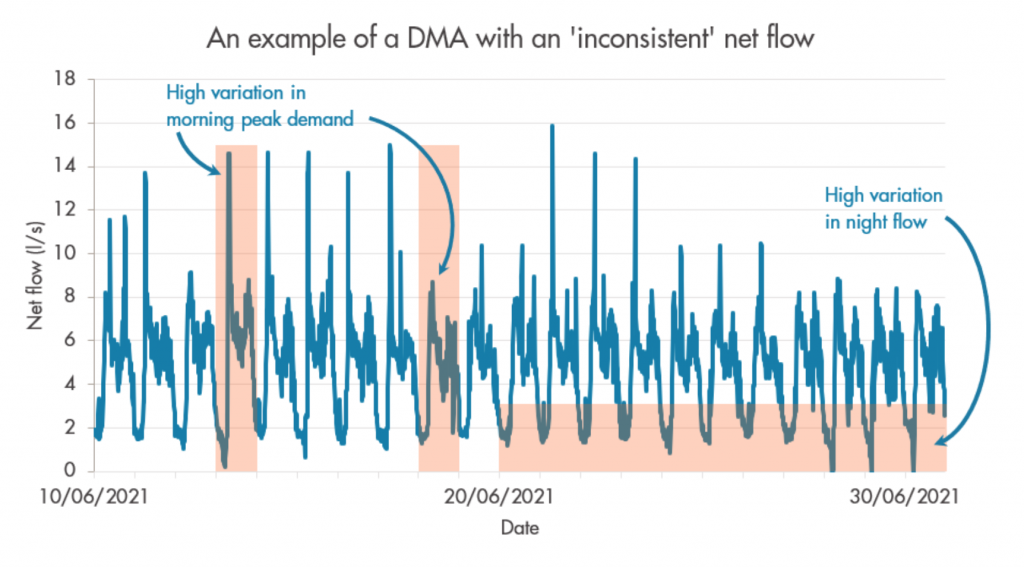
There were various aspects that resulted in some DMAs being categorised as ‘inconsistent’. In some instances, there were clear cases of temporary increased demand. In other cases, we observed a high variation in both the night and morning flow (as shown in Figure 2).
Figure 2: An example of a DMA with an ‘inconsistent’ net flow
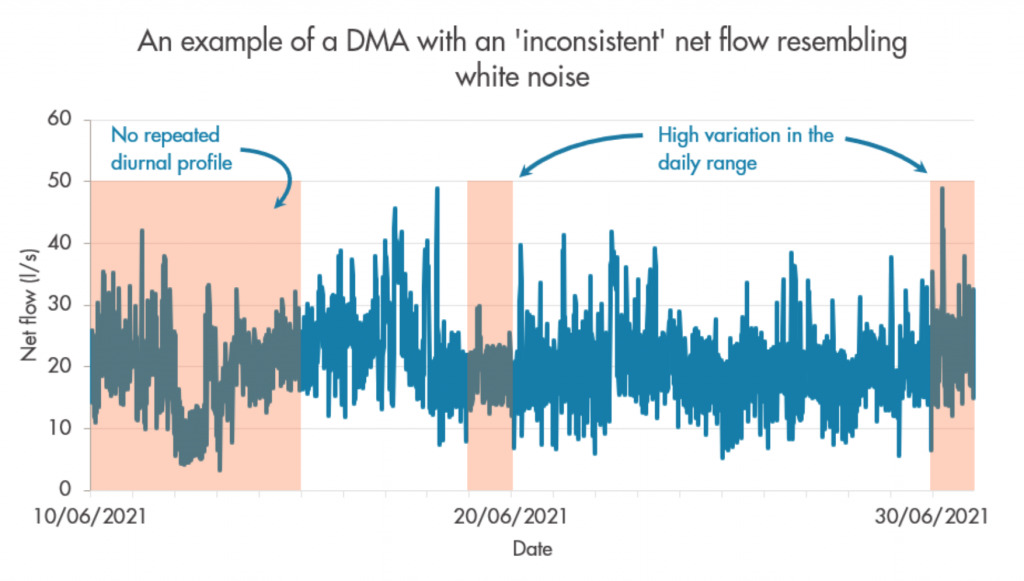
In other DMAs flagged as ‘inconsistent’, the observed net flow profiles were highly erratic and resembled white noise. (Figure 3). We found that these DMAs either had a high proportion of non-domestic usage or simply a very small property count.
Figure 3: An example of a DMA with an ‘inconsistent’ net flow resembling white noise
Next steps
From the dataset that was analysed as part of this research project, we found that 85% of DMAs can be classed as having a ‘consistent’ net flow profile. For these DMAs, we can hope to derive accurate expected profiles, increasing our confidence when modelling to identify anomalies. For the remaining 15% ‘inconsistent’ DMAs, we plan to conduct further analysis to develop an improved understanding that helps explain the various factors that affect those DMAs, particularly those with a high proportion of non-domestic consumption. This will allow us to improve the accuracy of our predictions for more complex DMAs in the future.

