Paradigm gives you a smarter way to manage your areas, categorising DMAs to fully understand what solution is required and the benefit that can be realised. By building a model of expected customer demand behaviour at DMA level, Paradigm allows analysts to confirm whether the net flow is representative of how each area should perform. This fundamental understanding of whether there is truly a leakage problem in an area ensures analysts can proceed with greater confidence.

Too often, traditional minimum night flow and minimum achieved analysis can send teams searching for leakage in areas where there are wider data and network integrity problems at play. By properly categorising opportunities at the outset, you can ensure that valuable leakage teams are sent where they can deliver the greatest impact.

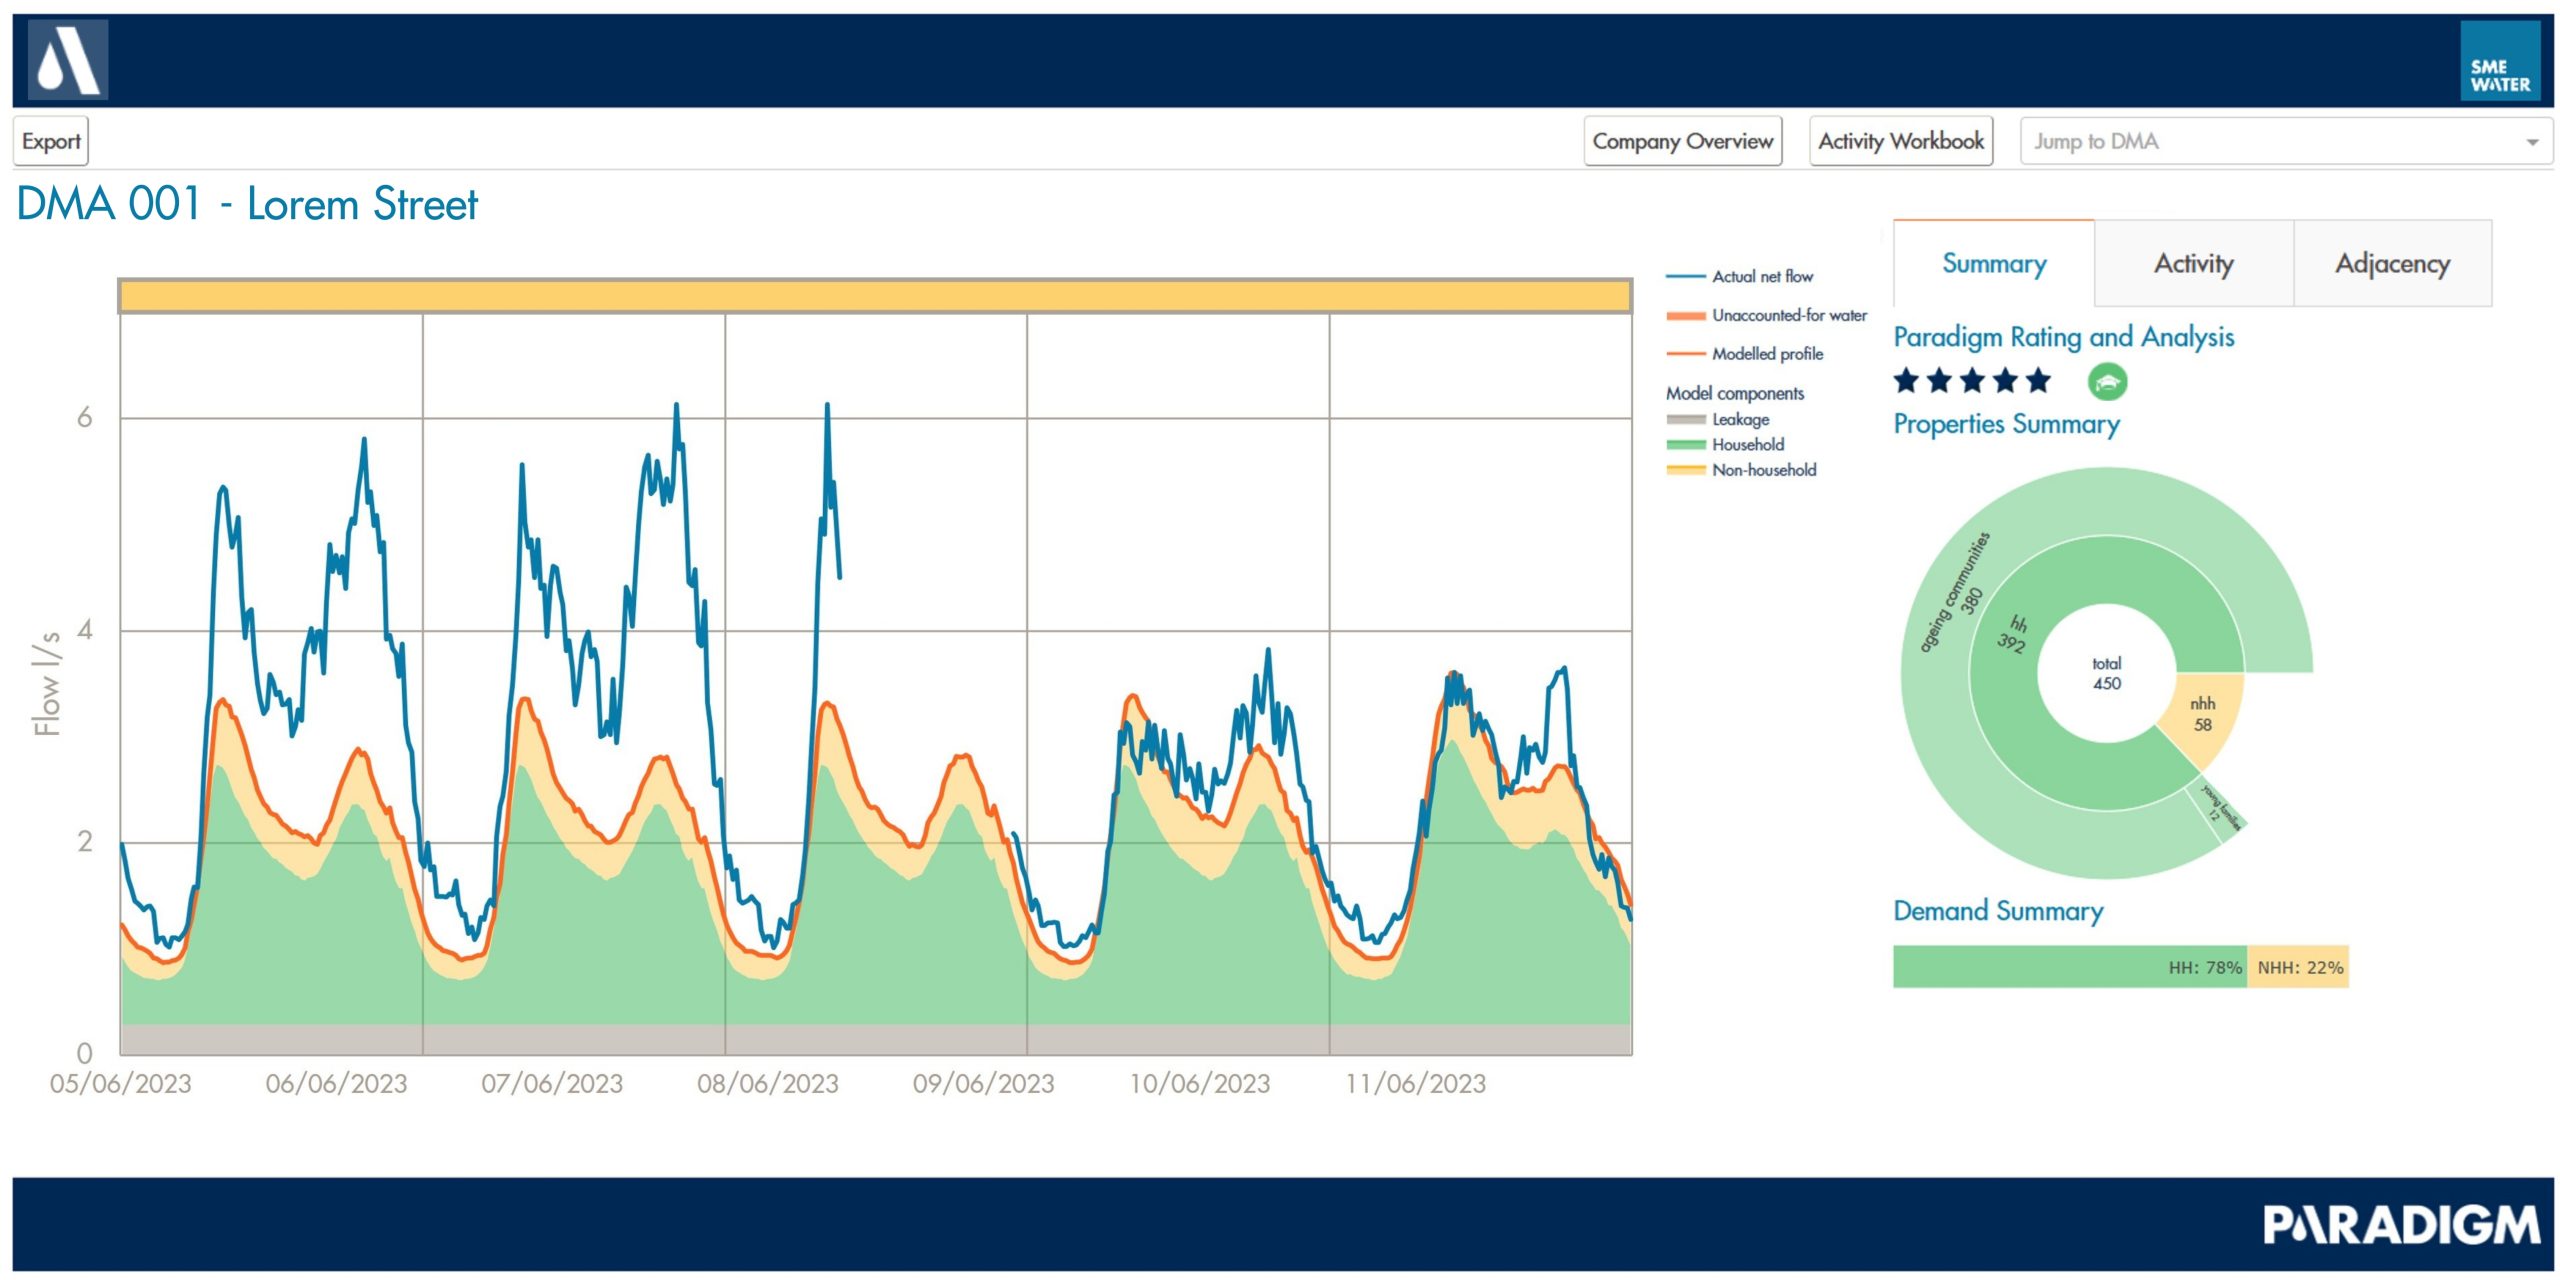
Instead of relying on minimum night flow or historic norms, Paradigm models expected demand for each DMA, providing a full 24-hour profile of expected demand. The difference between this profile and actual flow data highlights where intervention would be most valuable, allowing these DMAs to be prioritised and ensuring the right teams are directed to the right areas. By using a combination of customer data, ONS census data and other external data sources, including regional school term times, Paradigm generates tailored models for every DMA and places them into a recommended workstream each week.

Developed as part of a club project with English water companies, Paradigm provides a modern, data-driven perspective in the hunt for leakage; helping analysts prioritise their work and actively highlighting the confidence they can have in their models through the Paradigm Rating system.

Click into the interactive image below to learn more about the tools and guides available to Paradigm users. The DMA view is where analysts can review the difference between the model and the actual net flow over time. The graph shows an example of the resolution of a DMA breach with a neighbouring area. The yellow bar at the top of the graph indicates to users that the area is in the Integrity weekly workstream, suggesting a breach is likely.

Paradigm Interactive Graphic

The Properties Summary gives analysts an insight into the makeup of their DMAs, built using open source census data.

The Academy button takes users to our training site, where they can review articles and videos relevant to leakage investigations, case studies or simply the use of the Paradigm user interface.

The export button allows users to download the data in the overtime graph in a .csv format if they wish to interrogate it further in excel.

The Company Overview button gives users an overview of all DMAs subject to Paradigm analysis.

The Activity Tab allows users to record activities being carried out in the DMA and review those that have been raised against this DMA in the past.

The Activity Workbook is the central repository of all actions raised against Paradigm DMAs.

The Adjacency tab shows users what DMAs lie alongside the area they are investigating and shows the relationship between the areas, i.e. whether they are upstream, downstream or simply adjacent polygons.

The DMA badge provides additional information about the DMA that may not be immediately obvious, for example whether it is affected by changes in consumption linked to Ramadan or, in this case, whether it is a student DMA subject to the changes in consumption typical of a transient population.

The Paradigm Rating is a measure of confidence in the model for an area.

The Demand Summary gives a breakdown of the assumed demand in the area, broken down by Household, Non-Household and Continuously Logged Users.

The Weekly Workstream bar at the top of the performance graph shows the colour coded workstream that Paradigm applied to the net flow data. Each week Paradigm assigns every DMA a workstream.

The user can select which components of the modelled profile they wish to be able to see on the DMA performance graph.

This part of the graph is based on industry standard formulas and represents the expected background leakage in the area.

The Household component uses the most recent census data to predict the shape and volume of HH consumption by building up a picture of the area’s population.

Using billed volumes alongside an analysis of the patterns of consumption in an area, the non-household component estimates NHH demand through the week. Real data is used for continuously logged users due to their substantial impact on demand.

The orange line is the total of the Household, Non-household, CLU and background leakage components.

The blue line is real net flow data which is compared to the model.

Client testimonials

Features of Paradigm

Company overview

Paradigm presents users with a list of their DMAs alongside insights that allow for quick prioritisation of work. Highlighting week-on-week changes in behaviour, open jobs in the area and brief summary notes among other things, analysts are given the means to quickly order their approach to their work however they see fit.

Modelled profile

Each DMA features a modelled profile which is tailored to the specific demographics of each area. The modelled profile is modified in various ways throughout the year to account for predictable changes to consumption caused by predictable events such as school/university term times or Ramadan.

DMA level analysis

Users can review DMA flow data over time against the area model, record actions taken, and benefit from automated guides to the likely causes of divergence between flow and model. The flow and model data can also be downloaded for further analysis, including assessing the likelihood of a breach between two areas.

DMA confidence rating

DMA level models are rated from 0-5 stars depending on whether they have proven to be a good representation of actual net flow over time. The ratings allow analysts to easily identify areas with long term leakage reduction opportunity, as well as persistent data problems or demand that is not yet well understood.

Automated workstreams

Each week, DMAs are automatically placed into one of four workstreams to assist users in prioritising their work. The four workstreams of Maintain, Integrity, Leakage or Data, streamline work for analysts and ensure that operational teams are sent where they can have the greatest impact.

Weekly unaccounted for water (UFW)

Featuring weekly totals of the difference between the model and actual flow, Paradigm highlights DMAs where the greatest potential benefits can be realised. Empowering analysts to organise their areas by either the total volume of UFW or the week-on-week change in UFW, Paradigm presents a flexible approach to the prioritisation of work.

Area Insight

Paradigm provides a breakdown of consumers in a DMA to enhance analyst insight, including wider data sources such as ONS census data. Analysts can see at a glance the expected demand volume of Households, Non-households and CLUs as well as a property count breakdown of each category.

Benefits of Paradigm

Right solution in the right place

Accurate separation of leakage from demand and data issues ensures leakage targeting resources are sent to investigate the right DMAs, including where long-standing leakage can be found. The simple concepts and visuals within Paradigm enable analysts to easily explain complex issues to other network stakeholders, supporting their understanding and promoting engagement.

Fresh perspective

While minimum night flow is of course an important figure to track, Paradigm provides a more nuanced view using unaccounted for water (UFW). By taking UFW as its focus, analysts find Paradigm supports a wider range of decision making, allowing them to identify and resolve long-standing barriers to leakage detection.

A simple effective strategy

Paradigm creates a simple and effective top to bottom strategy that identifies opportunity, allows target setting and prioritisation, and sets clear expectations for delivery teams. Operational teams can clearly demonstrate the delivery of DMA level improvements using Paradigm ratings, which are automatically aggregated up to strategic benefits.

Prioritisation and targeted approach

Analysts have a clear view of how they should prioritise their workload from the outset, with Paradigm clearly identifying emerging issues and changing priorities on a weekly basis. Paradigm enables managers to effectively support analysts in the monitoring and escalation of persistent issues, ensuring timely resolution. 

Case studies

Below we highlight several case studies that demonstrate how Paradigm analysis helps our clients in practise.

Want clearer insight into your network?
Get in touch today!