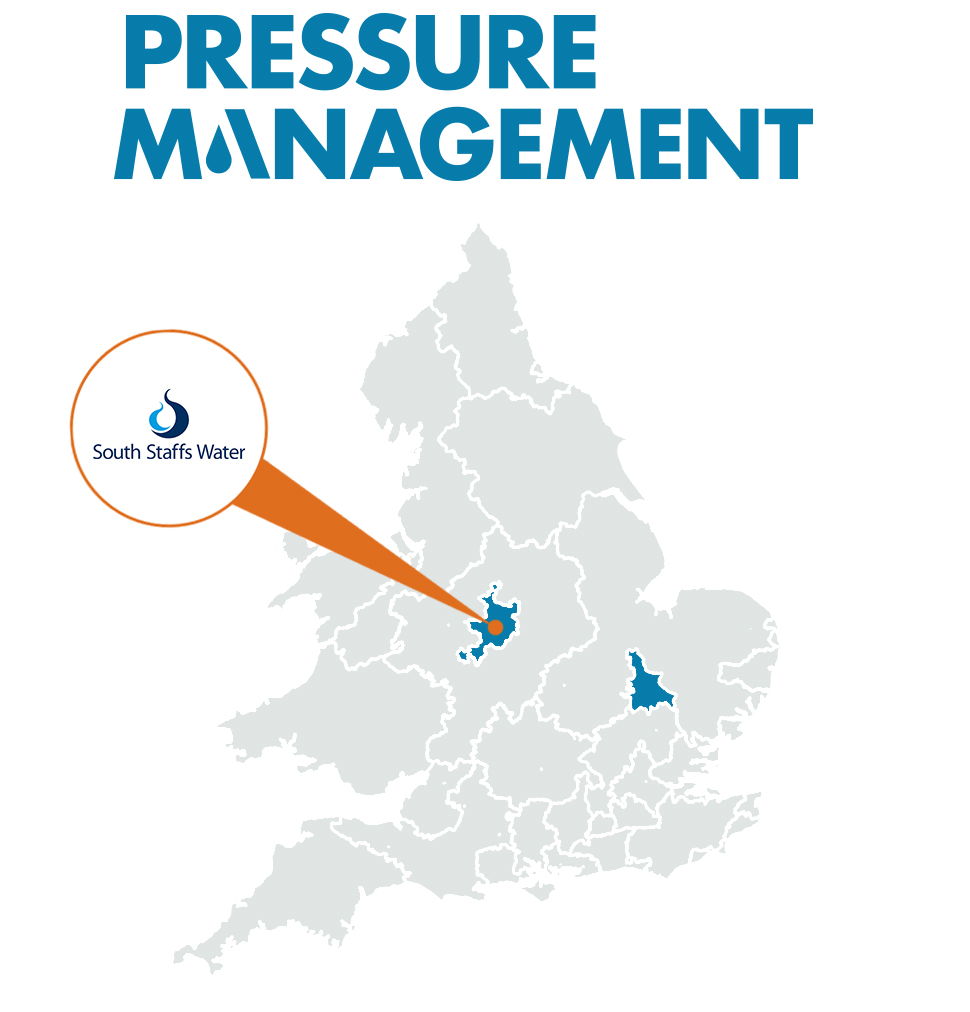
When South Staffs Water needed to identify where to concentrate their effort and resources as part of their leakage reduction strategy, our proven pressure management analysis approach was ready to assist. With significant leakage reduction targets, the client was keen to understand how best to apply their finite budget – and what to do first – to meet the challenge in time.
Pressure Management: South Staffs Water
South Staffs Water supplies both the South Staffordshire and Cambridge regions. We had previously delivered a similar project to comprehensively review pressure management opportunities across Cambridge, and were now called upon to run our analysis across South Staffordshire to complete the picture.

“We identified a possible 5 Ml/D in optimisations across more than 200 schemes, while the ten most promising new installations offer 1Ml/D in predicted burst flow reduction.”
The challenge
South Staffs Water were aware that there may be scope for further pressure management on their distribution networks but needed assistance to assess each of these opportunities and weigh their merits as part of a wider network optimisation strategy. They were particularly keen to begin making progress on leakage reduction as soon as possible, so this called for a two-stage approach.
Firstly, to review the current performance of all areas already implementing pressure management with respect to their target level of service. The results of this analysis would prompt a set of recommendations for optimisation which could be actioned relatively quickly with existing infrastructure to yield leakage savings.
Secondly, to review the current pressure performance across the rest of the distribution network and assess opportunities for new pressure management schemes which could be commissioned over the coming year.
Our solution
Having developed our pressure management analysis solution over multiple earlier projects, we were well-placed to perform the required analysis. Our team began by working with South Staffordshire Water to collate and cleanse the required data for the project, feeding back to the client where there were gaps or shortcomings so that these could be rectified where possible to maximise network coverage.
Once the network configuration and monitoring data had been prepared, the automated analysis was run and the results for existing pressure managed areas were output in a ‘leaderboard’ format, allowing the client to immediately begin to look closer at and action the most promising optimisations.
Meanwhile, we reviewed the scope for pressure reduction across the rest of the network and produced a leaderboard of DMAs which were predicted to offer the highest leakage reduction with the commissioning of new pressure management schemes. These results were reviewed with the client, and the ten most-promising schemes with fewest barriers to implementation were turned into design reports showing scheme extents, enabling works, area topography, pressure management valve sizing and installation location considerations.
We were also able to highlight several opportunities for more strategic schemes which might incorporate multiple DMAs to form a new pressure-managed zone.
The results
The analysis results predicted that the top 10 optimisations will reduce leakage by over 1 megalitre per day, and the top 10 proposed new schemes reduce by another 1 megalitre per day.
At the time of writing several of these proposed optimisations have been implemented, and the client has already been able to confirm for some areas that the minimum night flow has now reduced by close to the leakage saving predicted by our analysis. In some areas we haven’t observed the expected leakage saving and will return to look at these areas in six months time. It will be interesting to see what lessons can be learned to help improve our model.
