Water pressure has been shown to have a considerable impact on leakage and burst performance of networks, and it is generally accepted that by reducing excess pressure and minimising the range of pressure on the network this will improve asset performance. One way to achieve this is to install Pressure Reducing Valves (PRVs) at key points within the network. PRVs allow water companies to manage pressure on the network more effectively, creating a better experience for their customers.
SME Water were approached by Northumbrian Water in 2018, for help understanding the opportunities for new pressure management schemes on their network, and for SME Water to build a business case for further investment during AMP7. From then on, we have worked with Northumbrian Water to identify opportunities for new installations, undertake a cost benefit study, and produce detailed designs for the schemes. We have worked with our partners Hydrosave to provide support onsite to help us validate available pressures, understand transients in the network, and go on to commission the PRVs and install i2O’s latest PRV controllers onsite.
Our part in the project is now complete, and Northumbrian Water are currently calculating the benefit achieved from their new pressure management schemes.
Undertaking historic analysis to build a cost benefit model
To start the project, we looked at historical installations on Northumbrian Water’s network to understand the benefits which had been delivered from their previous projects. This allowed us to build a resilient approach to predict the benefits which could be achieved from further network calming activities across the rest of the network. We also looked into possible concerns that could be raised by customers and internal stakeholders, which could possibly form a barrier to the project. This would allow us to address these concerns with evidence and ensure the success of the project. Fortunately, Northumbrian Water had installed and commissioned a number of new schemes between 2010 and 2013, so we had some good examples to investigate. The following figures focus on data taken from these installations and show some of our key analysis outputs.
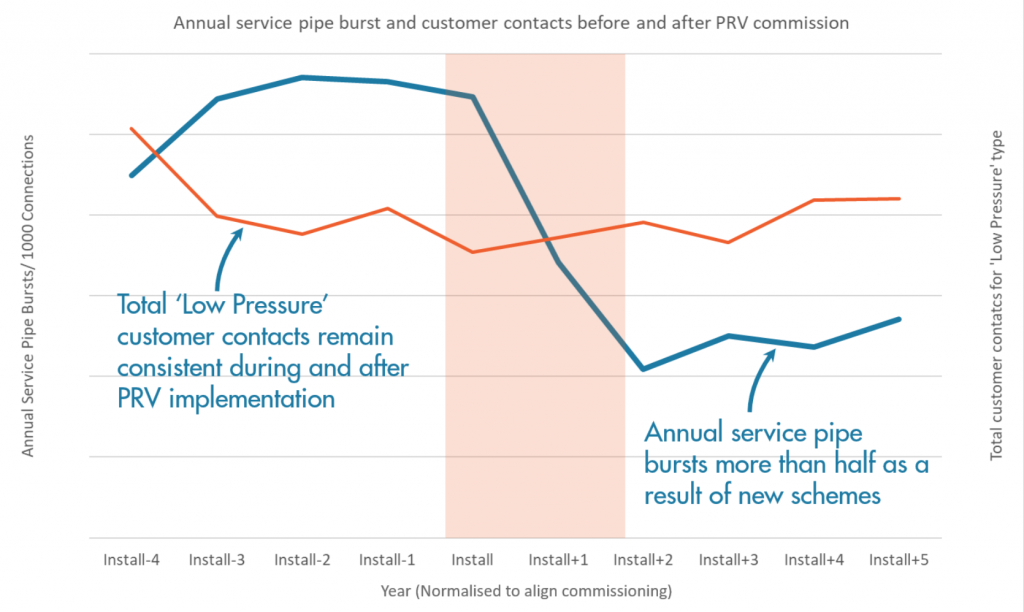
Figure 1 shows the impact of newly installed schemes on service pipe bursts and customer low pressure contacts in the areas for the four years before and after the installation of a PRV. The data consistently showed a significant reduce of bursts in all types, with this graph demonstrating that service pipe bursts were reduced by more than 50%. We also analysed customer contact data and were able to demonstrate that the level of customer contacts relating to low pressure concerns in these areas was unaffected. This assured Northumbrian Water that they could implement new schemes, delivering benefits while maintaining their unrivalled customer experience.
Figure 1: Annual service pipe bursts and customer contacts before and after scheme installation
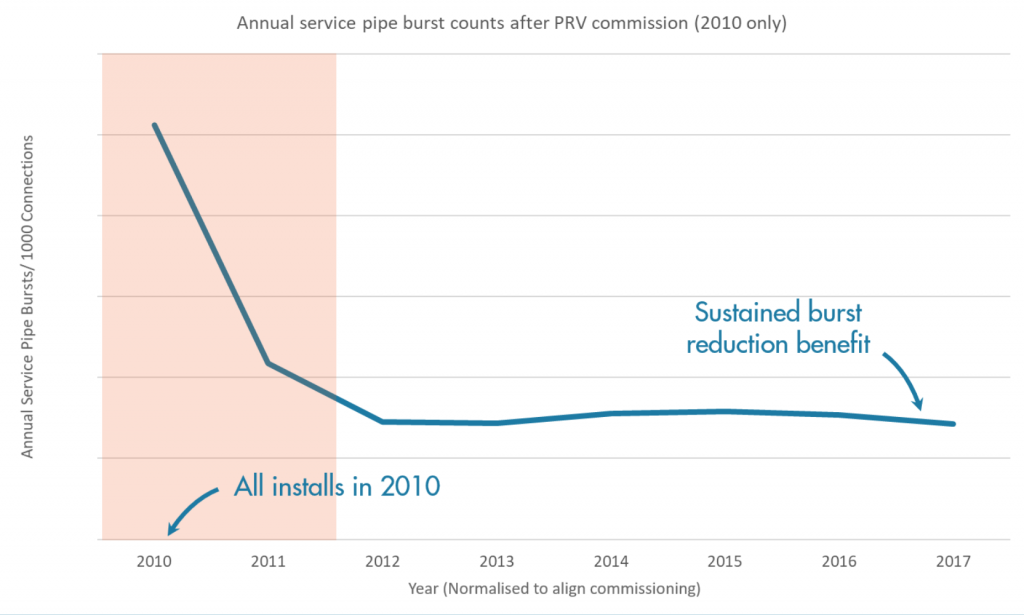
There were also concerns raised by stakeholders that benefits delivered from pressure management projects might not be sustained, with evidence from other water companies suggesting that water networks can ‘relax’ and adjust to the new pressure regime. This was expected to result in annual burst counts gradually increasing over time following a new scheme being implemented. As shown in Figure 2, our analysis of the schemes installed in 2010 by Northumbrian Water clearly shows that benefits were sustained for an extended period and showed no evidence of increasing. These burst levels have been sustained to most recent reported numbers.
Figure 2: Annual service pipe bursts following scheme installation
Data from our analysis was then used to create a cost benefit model which predicted the impact of new network calming schemes on three main areas.
- Reduction in the number of bursts and the associated cost of burst repairs.
- Reduction in leakage flow rates and the associated marginal cost of water saved.
- Reduction in the natural rate of rise and associated reduction in leakage detection resource costs.
New scheme designs
Potential schemes were identified from the cost benefit model, and then we identified geographic areas with multiple opportunities to implement new schemes. For these areas, the overall available pressures were reviewed alongside local factors to ensure that we could deliver the scheme whilst achieving minimum pressures for customers.
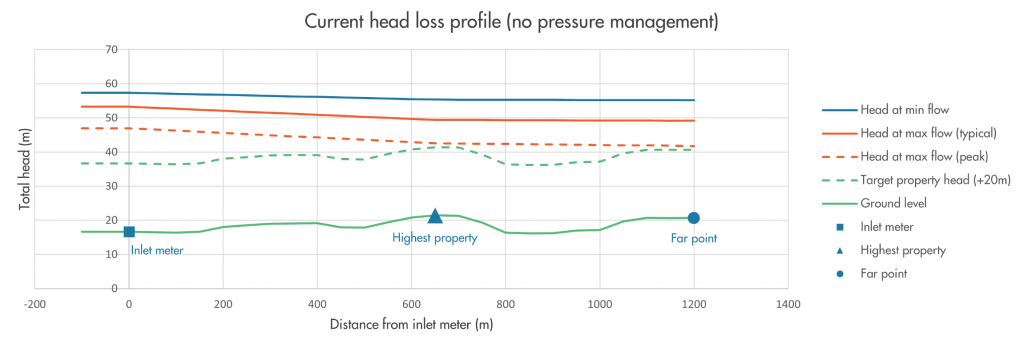
In the example shown in Figure 3, the total head in the DMA has been plotted to help identify opportunities and risks for implementing a scheme. Three scenarios have been plotted based on data analysed from the past five years; minimum flow (solid blue line), typical maximum flow (solid orange line), and a historical peak flow (dashed orange line). This can be compared against the existing ground level, and an assumed target property head, which ensures every property gets 20m pressure.
Figure 3: Head loss graph for an example scheme before implementation
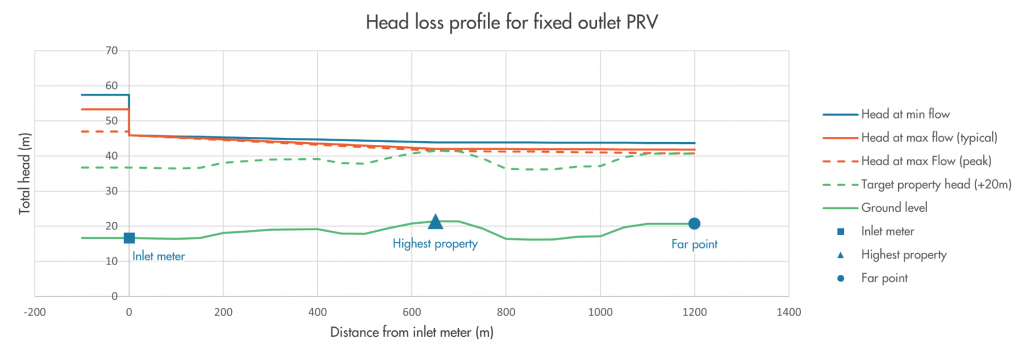
We can then simulate the installation of fixed outlet PRV at the inlet to the DMA, as shown in figure 4. This would allow us to reduce the pressure by around 12m at night (solid blue line), and 8m during the day (solid orange line), whilst maintaining at least 20m pressure to all customers (dashed green line). However, the graph also shows that during a historical peak event (dashed orange line) the pressure in the DMA was significantly lower than the normal pressure. During this scenario we may struggle to deliver the target 20m pressure at each property, raising concerns about the overall viability of the scheme in the longer term. Particularly as peak demand events are becoming more common in the UK.
Figure 4: Head loss graph for an example scheme after implementation
Validation and implementation
As part of the design phase, we worked with our experienced fieldwork partner Hydrosave to deliver onsite field tests to validate that the expected pressures from our designs matched those onsite. This was undertaken by deploying i2O’s logging equipment at key points in the DMA, with hydraulic modelling principles applied to estimate pressures during peak scenarios.
This logged data proved invaluable to the project as we were able to use i2O’s statistical analysis to identify transients on the network, which were investigated and resolved prior to any new schemes being implemented. This was important in preventing us from recommending schemes in areas where existing transients would have prevented the schemes from delivering benefit.
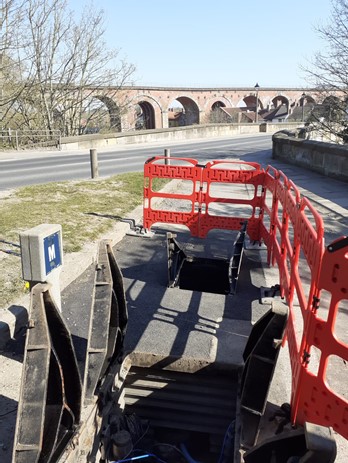
Following completion of the onsite activities we updated the designs with the insights gathered, and Northumbrian Water selected those with the best return on investment for implementation on their network. Figure 5 shows a photo of one of the new PRV arrangements installed earlier this year.
Figure 5: A new PRV and meter arrangement
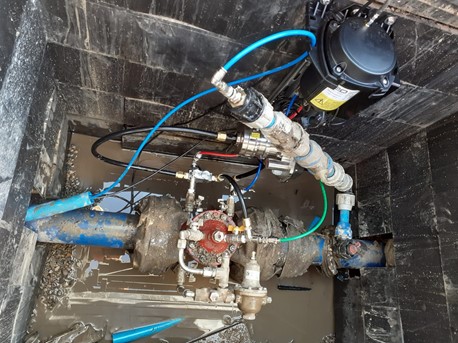
As part of the designs, we identified schemes where an i2O Advanced PRV controller, which allows Northumbrian Water to automatically optimise the downstream pressure on the valve, would deliver additional benefit. Following the completion of the installs, Hydrosave worked with Northumbrian Water to install and commission i2O PRV control systems on these sites. Figure 6 shows an example of an installed PRV control system.
Figure 6: A PRV with an i2O PRV control system installed
