In our most recent Paradigm user group in February, we shared some interesting analysis with our clients on how the cold snap throughout the first couple of weeks in 2025 impacted leakage within their DMAs. The resulting freeze thaw event in January was unusual as it affected all areas of the UK, giving SME Water the perfect opportunity to run some retrospective analysis on how an event like this impacts DMAs across the country.
Whilst Paradigm is not strictly a tool for targeting reactive leakage in an event such as this, as we are now receiving more live data from clients, we have been able to see in close to real time when DMAs go ‘pop’ during a freeze thaw event. A strength of our weekly workstream process is that every DMA is analysed at a daily level. The DMA is then assigned a rating based on the accuracy between our expected Paradigm model and the net flow; where a DMA’s flow increases beyond our accepted tolerance in both the nightline and daily flow then that day is given a 4* rating to denote potential leakage in the area. By analysing where, when and how daily ratings were affected during the freeze thaw event, we have been able to improve our understanding of DMA impact, as well as highlighting areas where improvements can be made to the model.
This blog will provide a deep dive into the analysis and share some key insights gained by investigating the event across our client base.
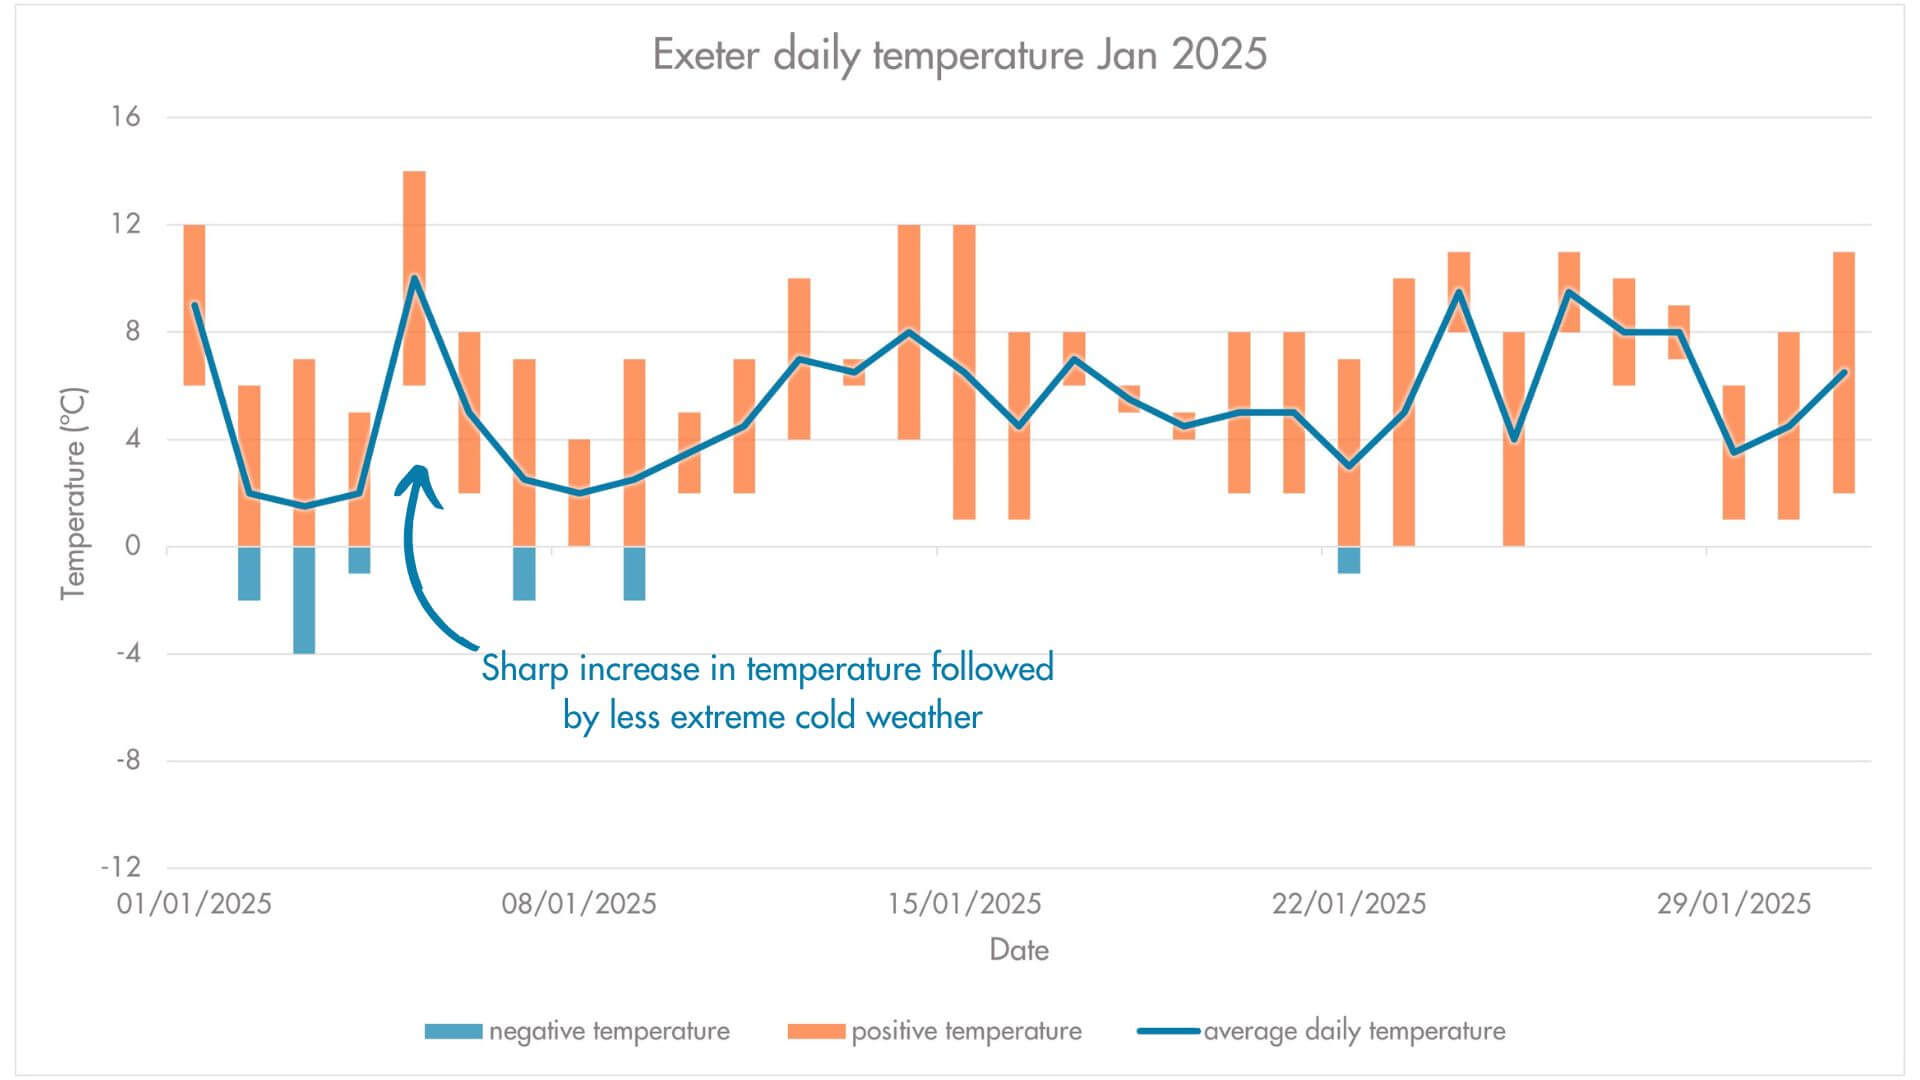
Freeze thaw events occur when a period of cold weather, where temperatures drop below freezing during the night for several consecutive days, are followed by a rapid warming where temperatures exceed 0ºC. This temperature fluctuation causes an increase in leakage as pipes are put under stress from changing temperatures, movement in surrounding soil during freeze-thaw and in some cases changes in demand related to customer behaviour. January 2025 saw a freeze thaw that was actually comprised of two events; one small freeze and subsequent warming between 02/01 and 06/01, followed by a more severe event culminating in a sharp warming on 13/01 (fig.i). This general trend in temperature was observed across the country with differing levels of severity, but all water companies within the Paradigm club project saw a definite impact to their leakage levels.
Most affected were water companies in the North-west, where cold temperatures both lingered for longer and were more extreme, with minimum temperatures recorded at -10ºC at Manchester airport on 11/01 (fig.i). In areas across the North, East and the Midlands there were similar conditions, although the minimum night temperature was not quite as low as in the North-west. In Southern areas temperatures were slightly warmer, reaching a minimum of -4 ºC during the first freeze thaw event. This was coupled with a very sharp increase in temperature on 05/01 that saw a daytime maximum of 14 ºC (fig.ii). the freeze thaw event that followed was also much lower level than in the North, and this in turn had an effect on the observed leakage that occurred across different DMAs.
Figure i. Manchester freeze thaw temperature data
Figure ii. Exeter freeze thaw temperature data
To identify whether a DMA had potential leakage related to the freeze thaw event, we analysed both the unaccounted-for water (UFW = Net flow – Paradigm model) and changes in Paradigm daily rating throughout January, which gave an indication as to whether there was a step change in net flow in the period. To add extra accuracy, each of our clients’ DMAs were matched to localised climate data across the UK so that changes in flow could be matched to critical
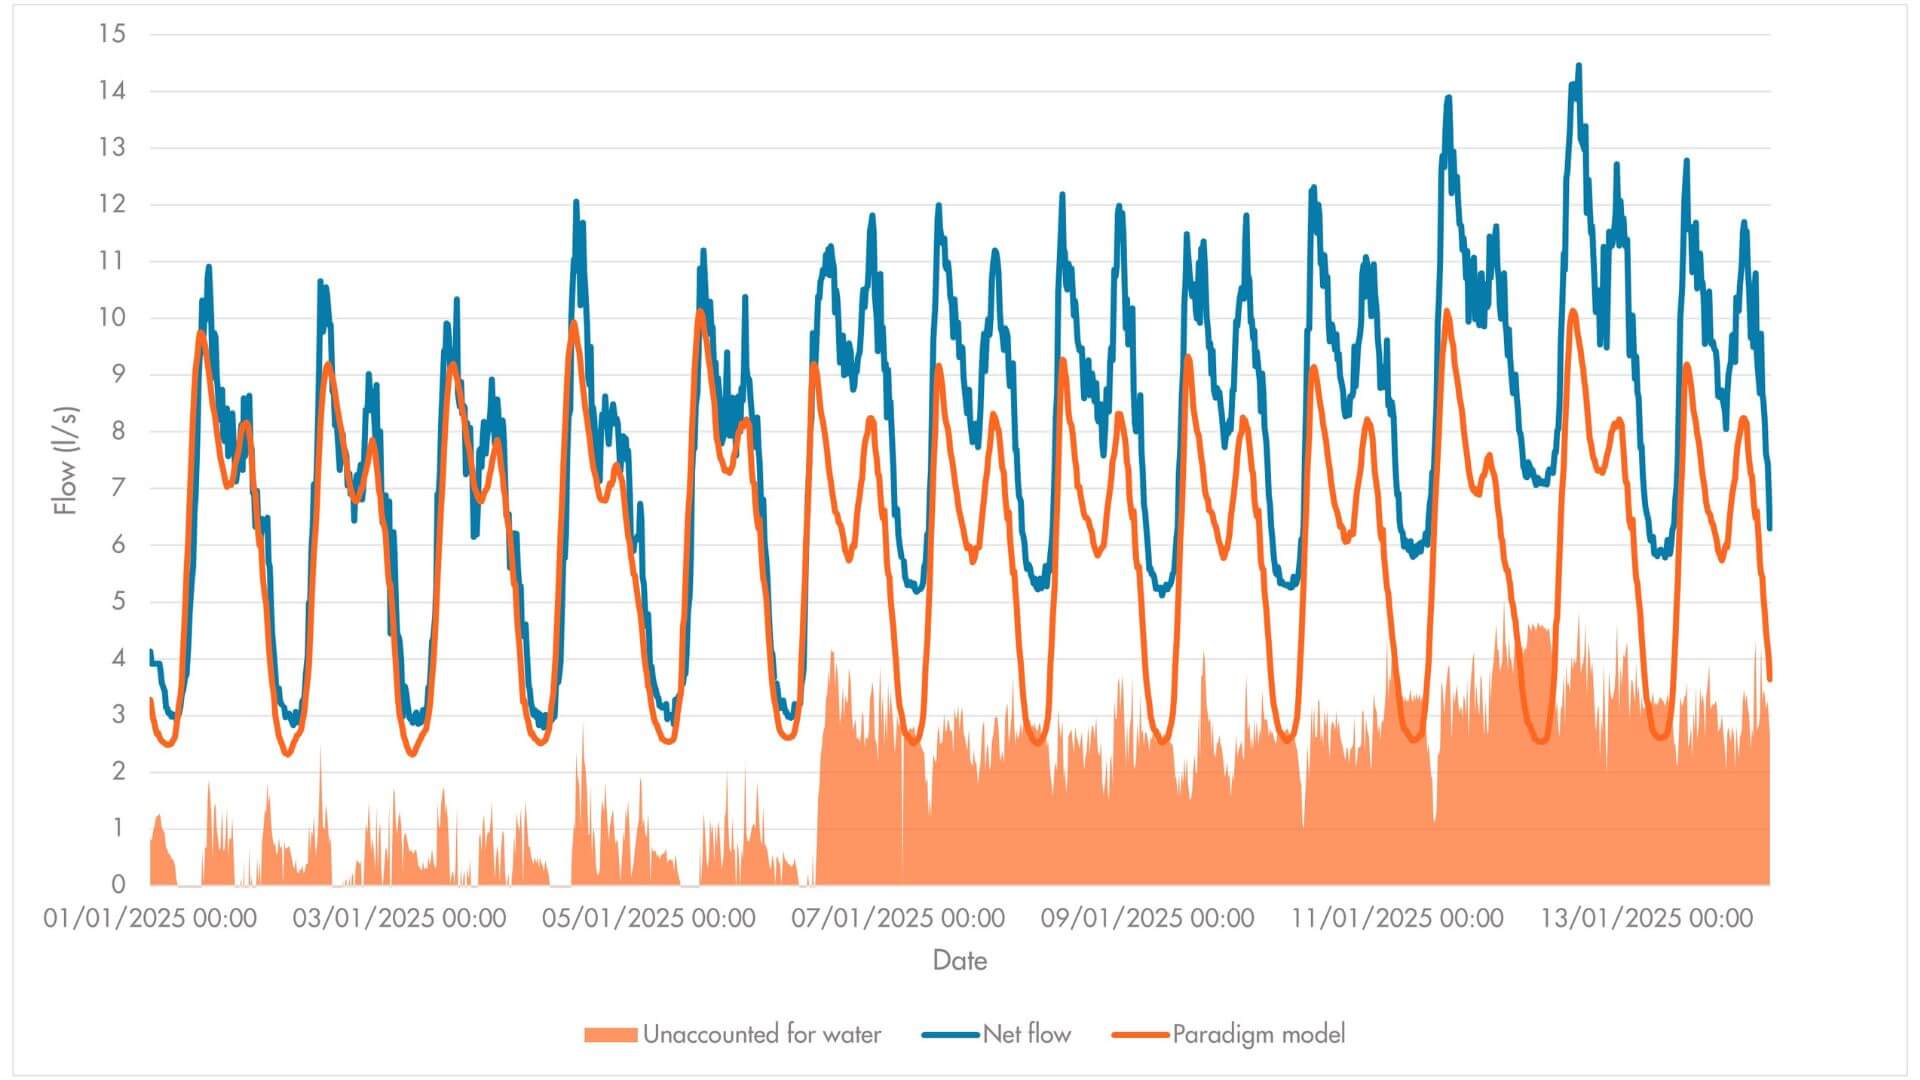
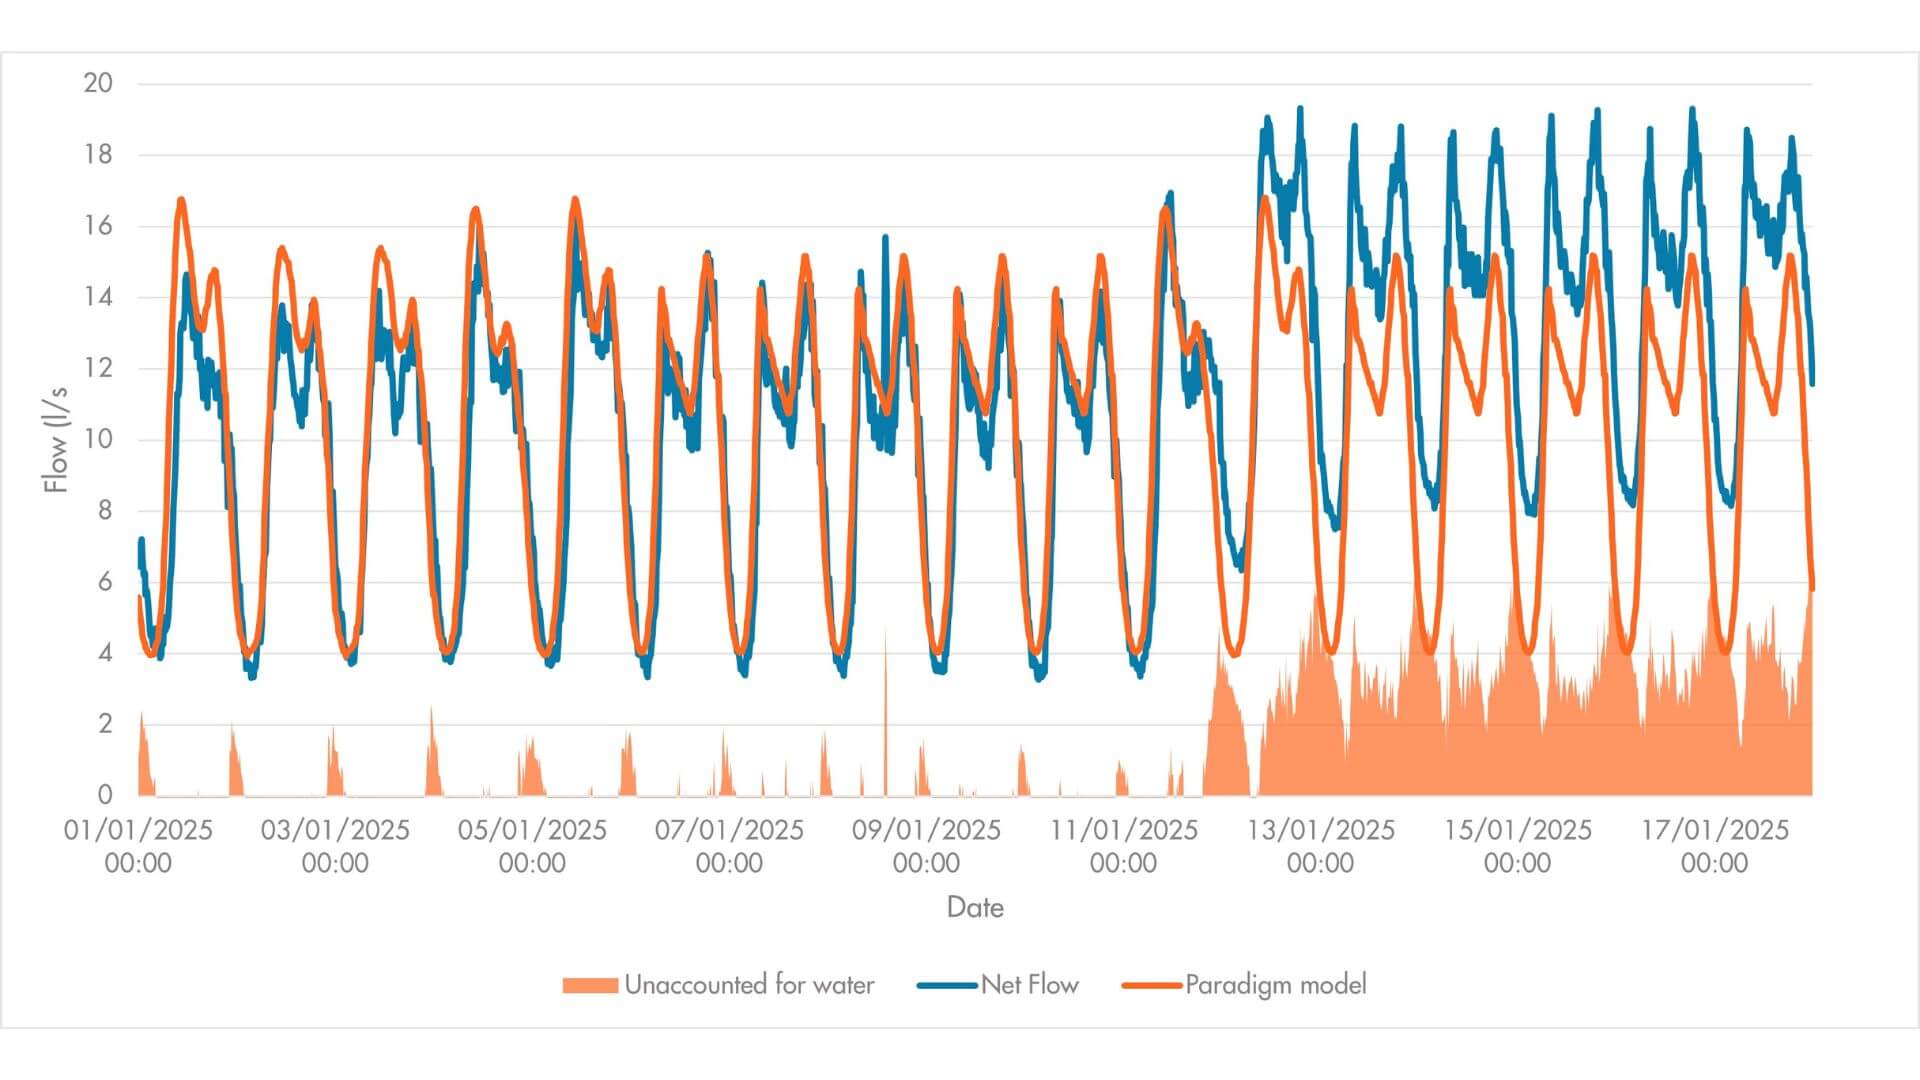
As there had been two separate freeze thaw patterns within the analysis period, DMAs that experienced an increase in UFW combined with a change to a 4* ‘Leakage’ daily rating were classified as either an ‘early leak’ or a ‘late leak’. Early leaks occurred between the first and second thaw events, whilst late leaks were assigned where changes occurred only following the second thaw (fig.iii & iv).
Figure iii. Example of early leak
Figure iv. Example of a late leak
To be assigned one of these categories a DMA must have experienced an increase in the average daily UFW values and had at least one day change to a 4* ‘Leakage’ daily rating from a different rating in either the early or late window. DMAs that were already assigned a ‘Leakage’ daily rating prior to the first localised thaw in early January were discounted from the analysis.
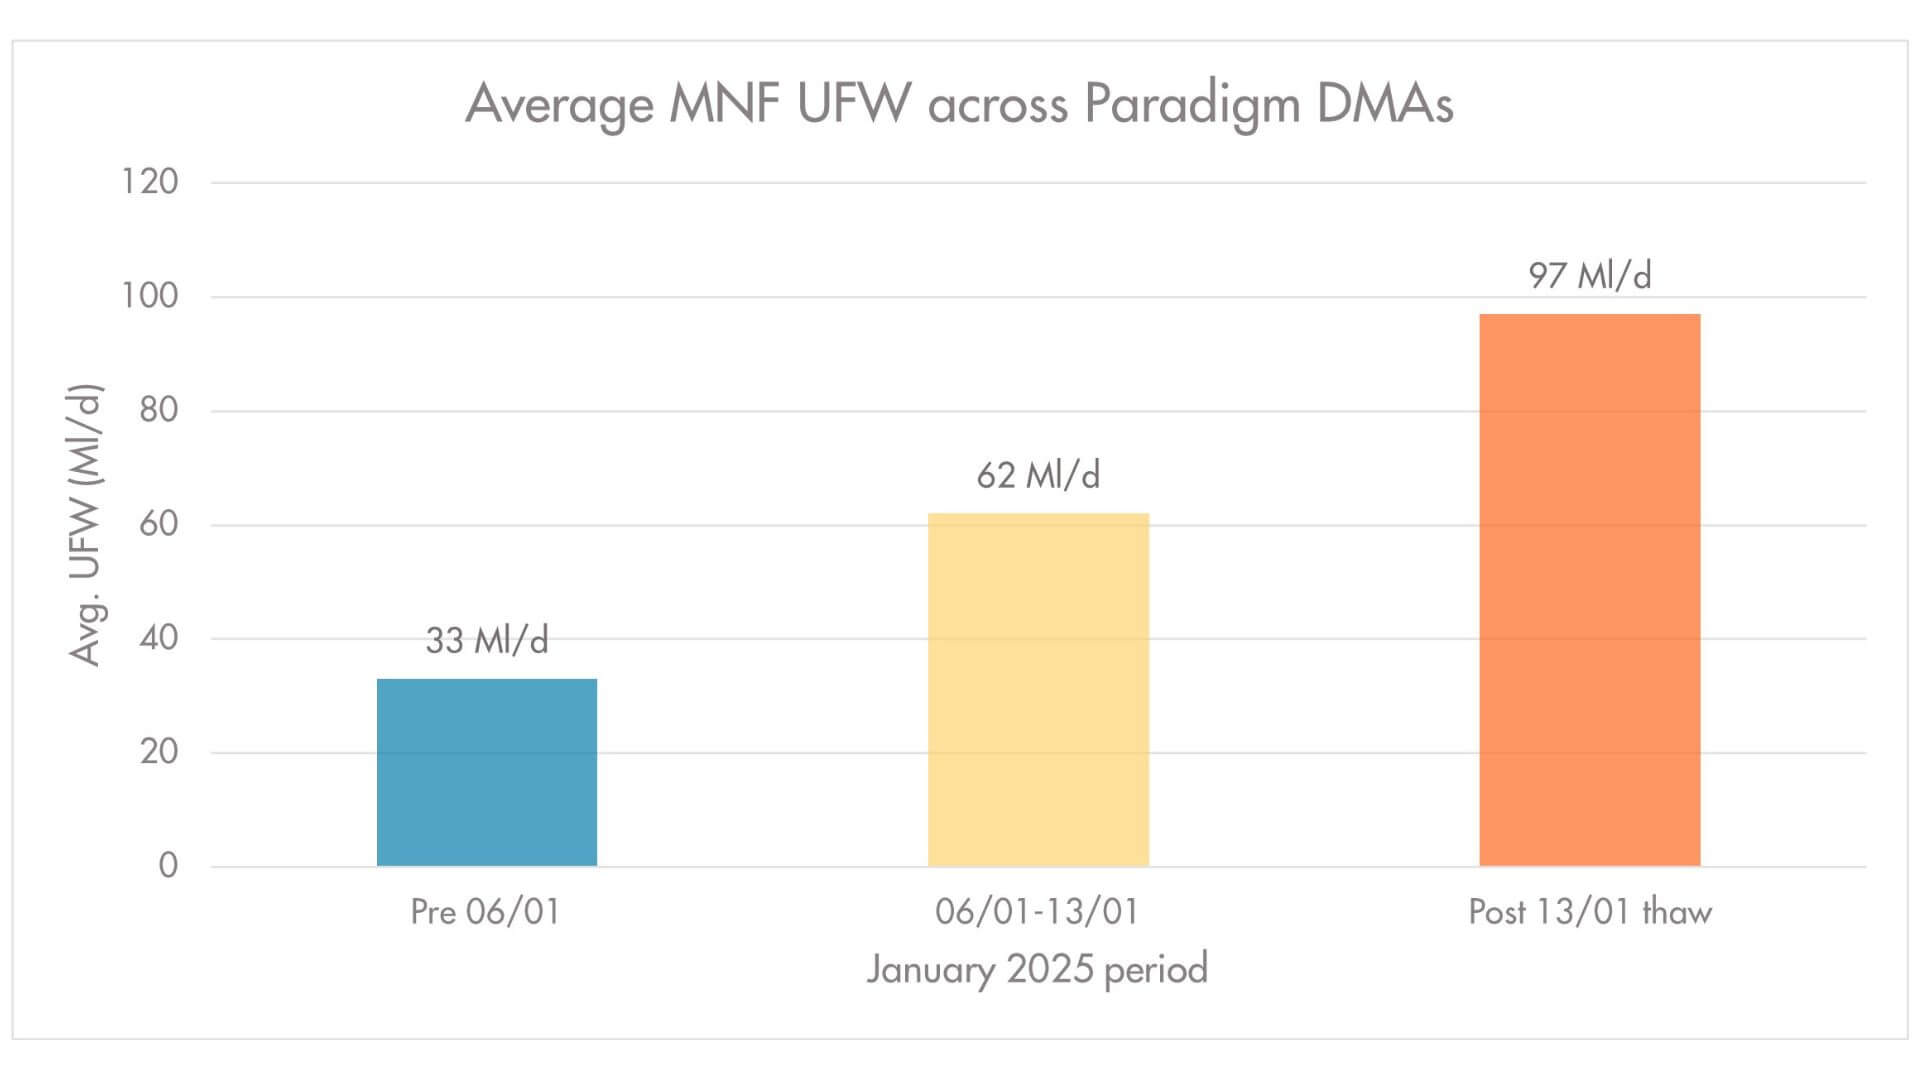
Using this approach, approximately 900 DMAs from a client base of over 11,000 were identified as having experienced new leakage due to the freeze thaw event. This equates to over 8% of DMAs within the Paradigm club project seeing a level of leakage across a few weeks. Over this period, we also observed a sharp increase in UFW within the minimum night flow (MNF) window, which we take as between 03:00 – 04:00 am (fig. v). This analysis has focussed on the MNF period as this represents an expected time where demand should be at a daily low point; as this event occurred at the end of a school holiday and during a time where commercial demand can vary due to Christmas shut downs we chose to aggregate UFW taken at the MNF rather than use average daily UFW, which could introduce discrepancies between model and net flow daytime demand. ggregated UFW in the 900 DMAs found to have been affected by ‘early’ or ‘late’ leaks increased from 33 Ml/d prior to the first freeze thaw pattern, up to 97 Ml/d by the time the second thaw had occurred on or after 13/01.
Figure v. Average MNF UFW in leakage DMAs
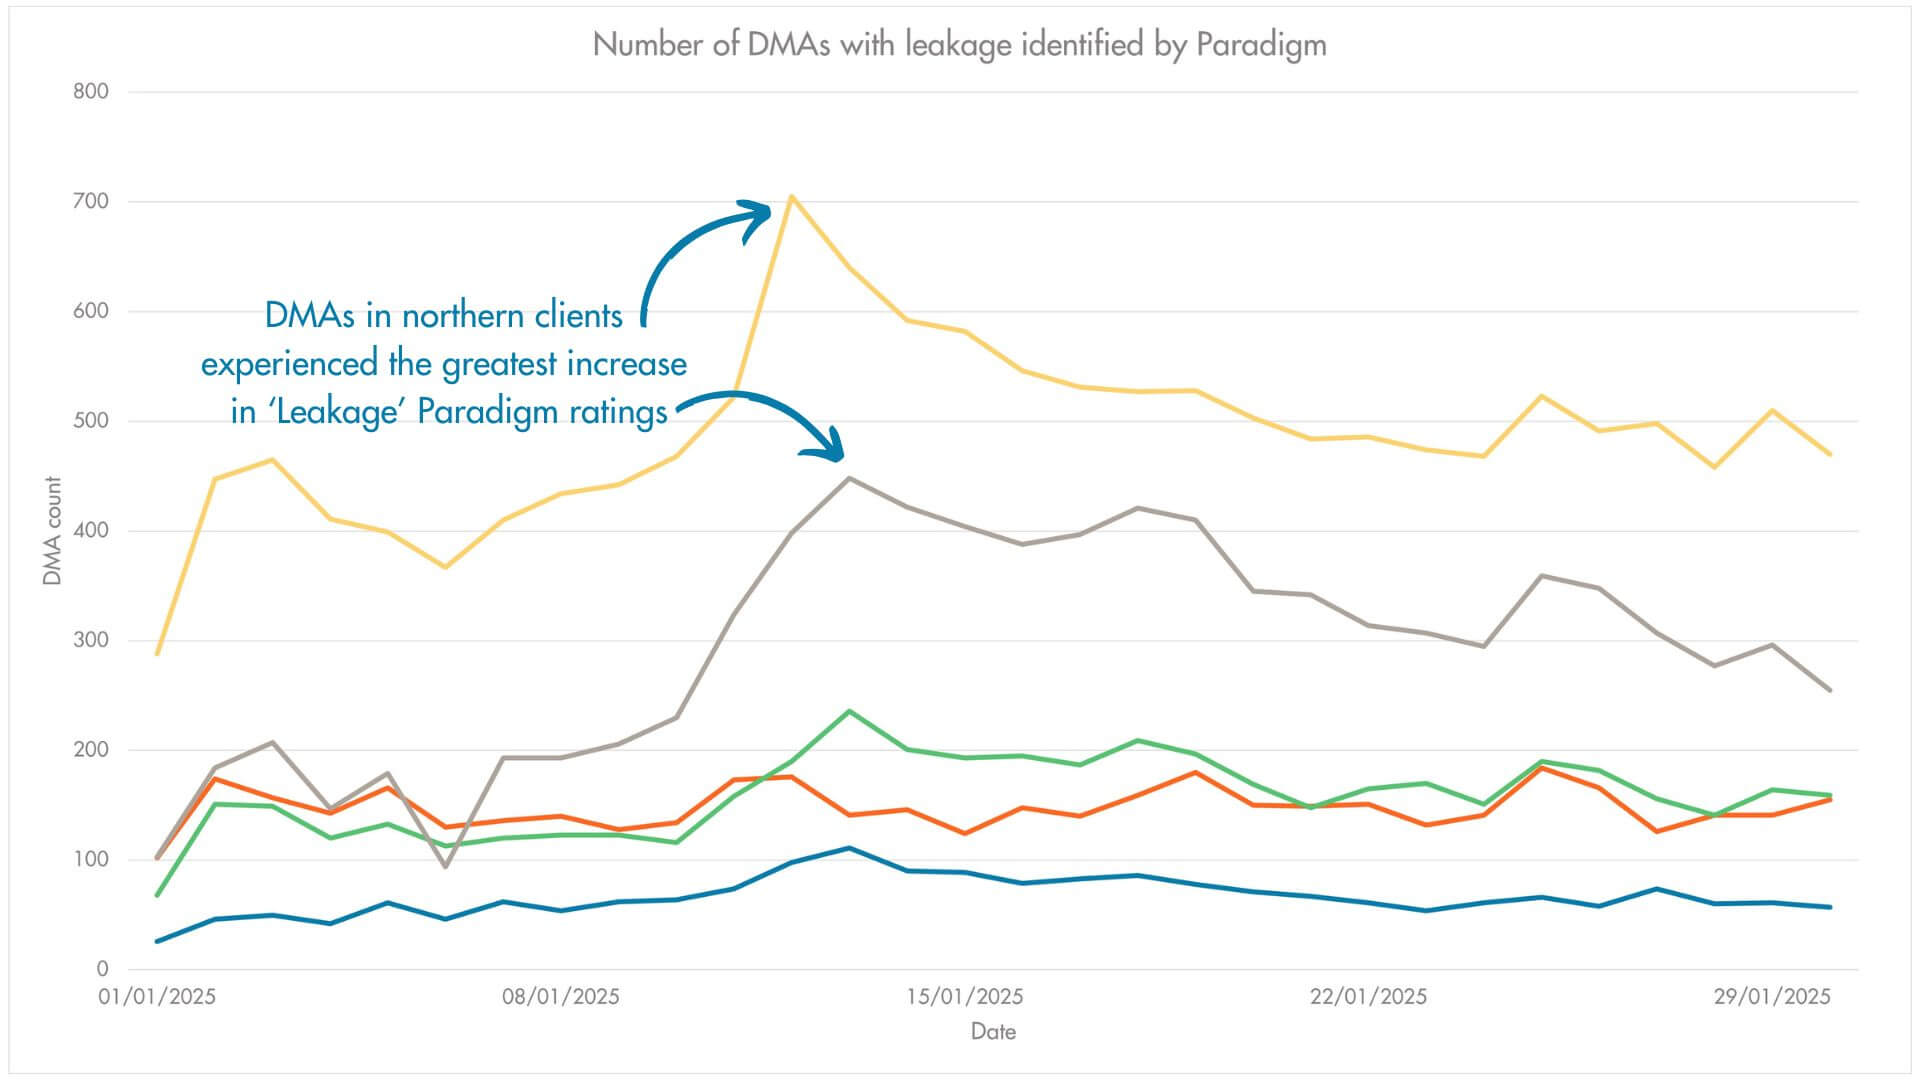
The impact of January’s freeze thaw event when reviewed using Paradigm showed an interesting variation across the client base. There was a significant difference in the number of leaks observed depending on geographical location, but also seemingly based on topography and the nature of individual DMAs. Overall numbers of DMAs experiencing leakage were far higher in clients across the North, where minimum temperatures were lower and more prolonged than elsewhere in the country (fig. vi). Generally, the number of DMAs affected reduced as the clients become more southern and western, with DMAs in extreme South-west experiencing very little general change over the period.
Figure vi. Count of DMAs assigned ‘Leakage’ daily ratings
In the North, an average of 70% of freeze thaw affected DMAs seem to have burst ‘early’ between 06/01 and 13/01. It is hypothesized that this is due to a small number of leaks occurring following the first thaw on 06/01, followed by more bursts triggered by the colder night temperatures. These early leaks also seem to be more likely to occur in rural areas, with towns and cities possibly shielded from the severe cold temperatures. There was a marked increase in ‘late’ leaks within urban areas in the North, especially those closer to higher ground, which may be due to the sharp thaw causing rapid temperature change and some level of deformation in the surrounding soils.
DMAs in the South and East seemed far more likely to burst following the thaw event on or after 13/01, with an average of 60% of identified leaks occurring ‘late’. Again, these leaks were weighted towards rural DMAs, and often occurred in pockets of adjoining DMAs, potentially due to shared mains and similar conditions creating bursts in particular areas.
Whilst Paradigm was able to identify potential leaks attributed to this event in over 900 DMAs, there are a number of areas with possible unassigned leakage that highlight a need for further improvement. 500 DMAs across all Paradigm clients saw an increase in MNF UFW throughout January but were not assigned a ‘Leakage’ daily rating on at least one day during or after the event. Having reviewed these cases, there is strong evidence to suggest that extra DMA complexity led to the potential leakage being missed. This could be due to erratic commercial demand causing discrepancies between model and net flow, issues with DMA integrity hiding leakage or difficulties modelling exceptionally small/large DMAs. However, this does present an opportunity for SME Water to investigate these areas in future to help shed light on any weaknesses the current model has in extreme cases.
Overall, although the January freeze thaw may have caused headache for UK water companies, the insights we have been able to take from this retrospective analysis have been invaluable. We can use this event and others in the past to help understand how freeze thaw patterns affect different DMAs and look for characteristics that could explain why some DMAs seem to burst during freezing conditions, while others burst once the thaw has occurred. We will also be using this data to help with our continuing work looking into seasonal demand and behaviours, as well as looking to make ongoing improvements to the Paradigm model.