Sample interval, logging interval and statistical analysis
Starting at the beginning, loggers are there to sample data from a sensor, which may be integrated with the logger. These samples typically present the instantaneous pressure at a given time, and the term “sample interval” is used to describe the number of samples taken over a given period. In the UK network data loggers are increasingly able to take a high number of samples to support with pressure transient investigation, with some loggers sampling at an interval of 128Hz (128 samples per second). Dedicated transient loggers can sample at even greater frequencies, increasing data insights significantly.
This sampled data is then aggregated using statistical analysis on the device (also referred to as edge analytics), with the standard for network logging in the UK being the mean of samples over a 15-minute logging interval. This aggregation significantly reduces the volume of data to be transmitted and, unless the data is intended for transient investigation, cleans up a lot of noise within the data set and simplifies the picture for analysts. The logging interval can be adjusted to provide a shorter interval if required and it is common for modern loggers to allow the option of multiple logging intervals to support with investigation of issues, for example a 1-minute or 5-minute logging interval alongside existing 15-minute logging interval data.
Modern loggers also provide additional statistical analysis over the same logging interval, including minimum, maximum and standard deviation of the samples taken. This can be useful for analysts who are looking to understand variations in pressure data, highlighting transients on networks and indicating if an operational asset may be starting to fail, for example an altitude or pressure reducing valve.
Connection interval and communication technology
Once data has been sampled and logged, modern loggers communicate this data to the water company for analysis through a cloud platform. Also known as the transmission interval, the connection interval is the frequency with which loggers transmit their data. Typically, in the UK network loggers dial in every 15 or 30 minutes.
Some water companies have increased their connection interval to every 1 minute which, when combined with a shorter logging interval, improves their ability to react quickly to changes in pressure on the network and identify issues before they impact customers. With analysts/systems typically looking for 2-3 similar data points before reacting to a change in pressure, having shorter connection and logging intervals means they can amass enough information to make a decision within 3 minutes, rather than having to wait 45 minutes for their 3 points to arrive.
Introducing alarm functionality within loggers typically allows the setting of fixed thresholds, with loggers communicating an alarm warning or providing additional data at a greater connection or logging interval when the threshold is breached. This can reduce the ongoing impact of communication on battery life whilst ensuring analysts still have access to data during events on the network.
Going back to the end of AMP6, most loggers in the UK would have been reliant on 2G cellular networks with key assets having dedicated phone lines or SCADA connections. Through AMP7, 2G capabilities have been supplemented with the introduction of NBIoT and LTE-M solutions and more flexible roaming SIM cards to make the most of the variations in available signal sources and environmental factors at each logger’s location. Whilst communication can still pose a problem for rural locations, options to improve this using dedicated LPWAN networks and satellite communication are becoming more widespread.
It is common in the UK for water companies to specify a minimum of a 5-year asset life for network loggers, which can be difficult to achieve when a frequent connection interval can drain battery life. To provide a solution to this, most loggers have the option of an ancillary external battery pack to extend its overall life.
Data latency in systems
Whilst a logger might dial up every 15 minutes, there will typically be a delay between the data being communicated from the logger and being available for analysis by software platforms or for an analyst to view in their systems. It is important to consider the processes/systems which are chained together and the impact they will have on the flow of data through the system. Even for relatively simple systems this can mean that users don’t get data in their systems for 2 to 3 hours after a logger has dialled in, affecting their ability to react quickly to changes on their network. This is known as data latency, and it is important to understand this fully if pressure data is to be used for pro-active alarms and reactive analysis before looking to adjust logger settings.
Sensor range, accuracy, resolution and drift
Pressure loggers use transducers as their sensor for monitoring pressure. Transducers on water distribution networks are typically designed for a range of pressure of 0-100m (similar to 0-10 bar) with additional options available to cover pressure ranges up to 300m (30 bar). Where the pressure being monitored is higher than the specified range of the transducer there is a risk that the high pressure could damage the transducer, so it is important to select the right transducer for the expected range of pressure.
In the UK it is common to use external transducers, rather than internal transducers connected to the monitoring point with a coiled hose. In sustained below zero temperatures, these coiled hoses can freeze permanently damaging transducer. This can be particularly significant where the logger needs to be housed above ground or close to the surface for access.
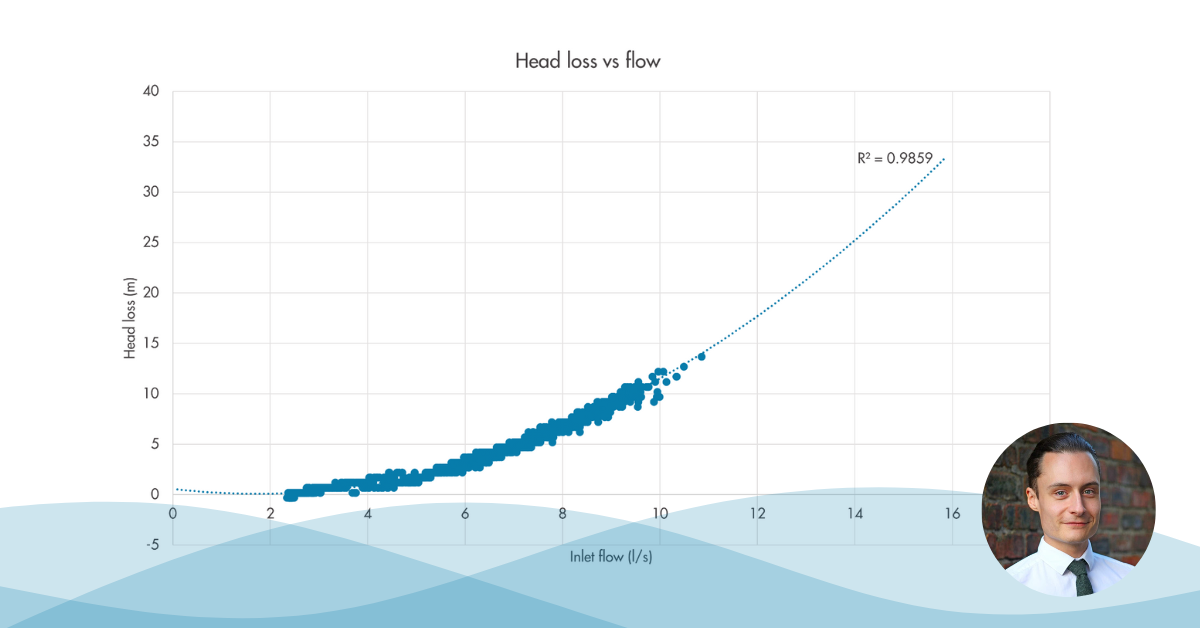
Accuracy of transducers is expressed as a percentage of Full Scale (FS), which refers to the maximum specified range of the transducer. Typically, a network logger would have +/- 0.1% FS, which on a 0-100m pressure transducer would mean +/-0.1m (or 10cm). This should be considered when using pressure logging for network analysis, including locating the causes of high flows (potentially leakage or demand) as the combined accuracy across two loggers might not be enough to reliably pinpoint the actual headloss a flow rate might generate. This is particularly problematic for lower flow rates on smoother plastic mains.
Some loggers have a programmable resolution, which means you can set the logger to record measurements in bigger or smaller steps, allowing the user to achieve a longer battery life and smaller data files, in exchange for a lower loss of detail of logged data. This can make the difference between showing data to a resolution of 3 or more decimal places of a meter, or automatically “round” to a resolution to one decimal place, or even the nearest half a meter. Using a lower resolution can again make it difficult to understand headloss across pipe networks, and two loggers at a half meter resolution could easily be masking a headloss of 0.5m and potentially up to 1m in the extreme.
Drift in pressure transducers is a gradual change in the output over time, which can be caused by general wear on the transducer or a single event damaging the transducer, for example exceeding its pressure range or light freeze–thaw damage. Pressure transducers should be checked for calibration, typically by cross referencing data to other permanent or temporary logging sites.