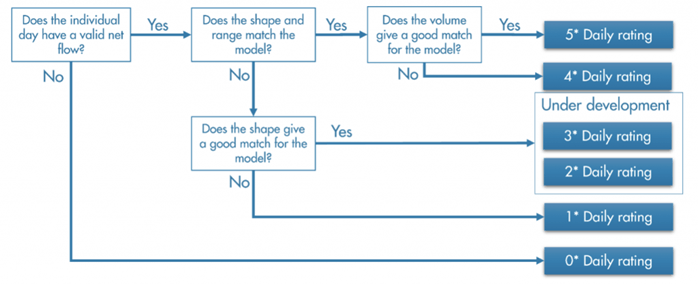
This daily rating is aggregated up to a weekly value, which informs the Weekly Workstream. On a quarter-by-quarter basis we review the weekly ratings of every DMA subject to the analysis, looking for improvements that suggest a model is becoming a better match with net flow i.e. consumption in the area is becoming better understood as issues are resolved. If there is no improvement, the area retains the same Rating it had last quarter, whereas in areas that see consistently better matching between flow and model, we raise the quarterly rating to reflect our increased confidence in the model. This review of weekly values becomes the area’s Paradigm Rating (a more detailed breakdown of this process is available to users of the Paradigm Academy in the article that accompanies the ‘Getting the most out of Paradigm’ course).
Where actual net flow matches the model’s expectations for long enough, we understand that we have a good model and where we see consistently low weekly ratings we know our understanding of an area is incomplete, for reasons ranging from flatlining loggers to unknown consumption.
So, at the risk of labouring the point, an area that has a 5* model is one where consumption in an area has proven to be well understood. Further, in these areas, we can be relatively sure of the nature of any divergence between net flow and model. By looking at the shape of the unaccounted-for-water (the difference between the model and the net flow) we can infer likely causes and raise actions with confidence. So, for example, when a 5 star area is placed in the Leakage weekly workstream, we know (Please refer to the logic diagram in figure 1) that, while the shape and range of actual net flow is still consistent with the model, the volume of flow has risen above the threshold Paradigm deems to be normal behaviour – prompting a leakage investigation.
A more tentative response would be prompted in a 1 star area. Areas with a 1 star Paradigm Rating have never yielded a good match between model and net flow. Common causes include long term problems with flow data or industrial processes that sporadically draw significant volumes from the network but that have not been continuously logged. Should a 1 star area fall into the Leakage Weekly Workstream, a Paradigm user is aware that the model has not yet ‘proved itself’. This means, there are issues that need to be resolved before we can say whether there is likely to be leakage in an area based solely on Paradigm’s recommended workstream.
In summary, by looking at how well a model has matched flow over months and years we provide a measure of confidence that the user should refer to when looking at the weekly performance of a DMA against its model. If we have high confidence in the model over the long term, diagnosis of emerging issues can be made quickly and with surety. Where we have low confidence in the model, we know that the actual net flow has never been in line with expectations and so the causes of further divergence between the two are more opaque. In these areas, it is essential to get to the bottom of why demand is not well understood and the Rating helps signpost long term issues and prevent them from slipping into obscurity.
This all perhaps sounds quite basic, but an additional benefit worth highlighting is something that I’m sure happens in almost every water company. If an area has exhibited a consistent pattern of behaviour and no problems have been unearthed for long enough, it is often taken to be the ‘new normal’ in the course of normal staff turnover. Paradigm keeps longstanding issues in the spotlight by saying ‘hang on, this might have behaved like this forever but it’s not behaving in line with what should be expected’. So, at the risk of turning up some unwelcome surprises, Paradigm puts good data quality at its heart and by comparing long term behaviour with short term, presents analysts with information that is as a complete as possible about an area based on what should be expected of users, not historical performance.
